

Energy Shift
Sizing Up: The Oil Market vs Top 10 Metal Markets Combined
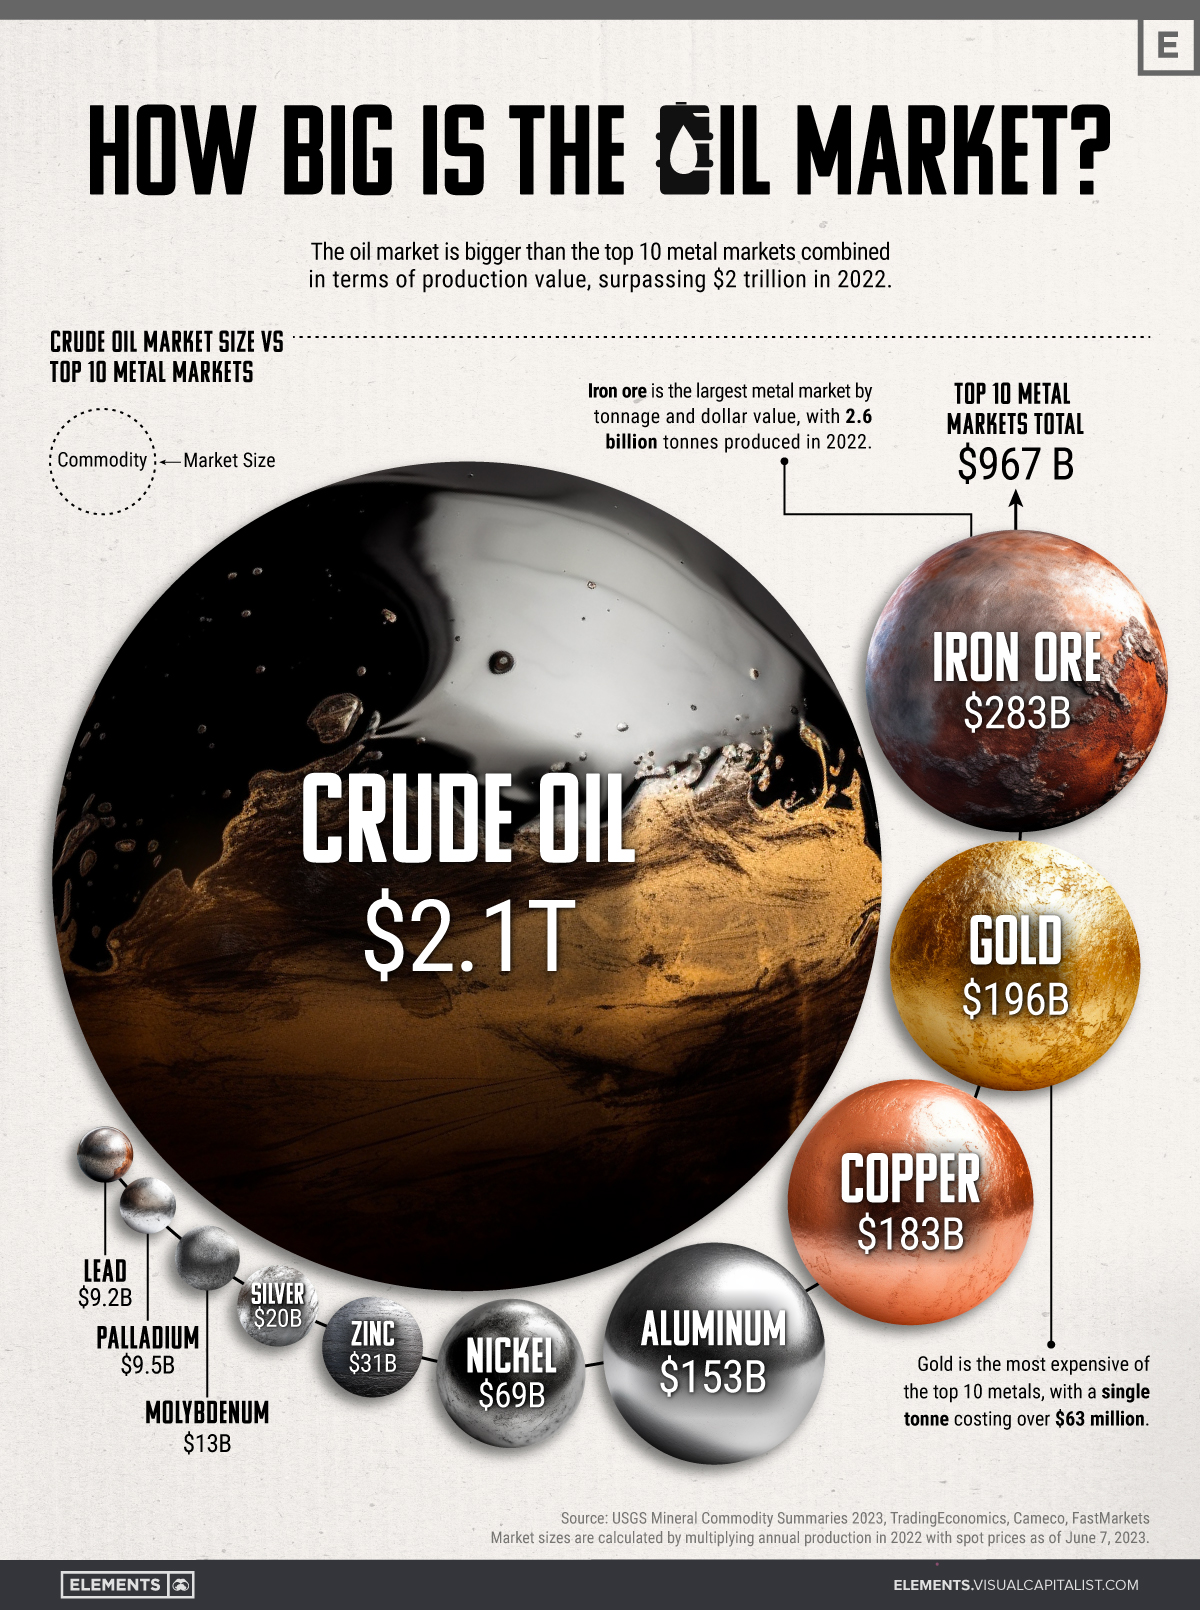


The Size of the Oil Market vs Top 10 Metal Markets
While the global economy relies on many commodities, none come close to the massive scale of the oil market.
Besides being the primary energy source for transportation, oil is a key raw material for numerous other industries like plastics, fertilizers, cosmetics, and medicine. As a result, the global physical oil market is astronomical in size and has a significant economic and geopolitical influence, with a few countries dominating global oil production.
The above infographic puts crude oil’s market size into perspective by comparing it to the 10 largest metal markets combined. To calculate market sizes, we used the latest price multiplied by global production in 2022, based on data from TradingEconomics and the United States Geological Survey (USGS).
Note: This analysis focuses on raw and physical materials, excluding derivative markets and alloy materials like steel.
How Big Is the Oil Market?
In 2022, the world produced an average of 80.75 million barrels of oil per day (including condensates). That puts annual crude oil production at around 29.5 billion barrels, with the market size exceeding $2 trillion at current prices.
That figure dwarfs the combined size of the 10 largest metal markets:
| Commodity | 2022 Annual Production | Market Size |
|---|---|---|
| Crude Oil | 29.5 billion barrels | $2.1 trillion |
| Iron Ore | 2.6 billion tonnes | $283.4 billion |
| Gold | 3,100 tonnes | $195.9 billion |
| Copper | 22 million tonnes | $183.3 billion |
| Aluminum | 69 million tonnes | $152.6 billion |
| Nickel | 3.3 million tonnes | $68.8 billion |
| Zinc | 13 million tonnes | $30.9 billion |
| Silver | 26,000 tonnes | $19.9 billion |
| Molybdenum | 250,000 tonnes | $12.9 billion |
| Palladium | 210 tonnes | $9.5 billion |
| Lead | 4.5 million tonnes | $9.2 billion |
Based on prices as of June 7, 2023.
The combined market size of the top 10 metal markets amounts to $967 billion, less than half that of the oil market. In fact, even if we added all the remaining smaller raw metal markets, the oil market would still be far bigger.
This also reflects the massive scale of global oil consumption annually, with the resource having a ubiquitous presence in our daily lives.
The Big Picture
While the oil market towers over metal markets, it’s important to recognize that this doesn’t downplay the importance of these commodities.
Metals form a critical building block of the global economy, playing a key role in infrastructure, energy technologies, and more. Meanwhile, precious metals like gold and silver serve as important stores of value.
As the world shifts towards a more sustainable future and away from fossil fuels, it’ll be interesting to see how the markets for oil and other commodities evolve.


Energy Shift
The World’s Biggest Oil Producers in 2023
Just three countries accounted for 40% of global oil production last year.

The World’s Biggest Oil Producers in 2023
This was originally posted on our Voronoi app. Download the app for free on iOS or Android and discover incredible data-driven charts from a variety of trusted sources.
Despite efforts to decarbonize the global economy, oil still remains one of the world’s most important resources. It’s also produced by a fairly limited group of countries, which can be a source of economic and political leverage.
This graphic illustrates global crude oil production in 2023, measured in million barrels per day, sourced from the U.S. Energy Information Administration (EIA).
Three Countries Account for 40% of Global Oil Production
In 2023, the United States, Russia, and Saudi Arabia collectively contributed 32.7 million barrels per day to global oil production.
| Oil Production 2023 | Million barrels per day |
|---|---|
| 🇺🇸 U.S. | 12.9 |
| 🇷🇺 Russia | 10.1 |
| 🇸🇦 Saudi Arabia | 9.7 |
| 🇨🇦 Canada | 4.6 |
| 🇮🇶 Iraq | 4.3 |
| 🇨🇳 China | 4.2 |
| 🇮🇷 Iran | 3.6 |
| 🇧🇷 Brazil | 3.4 |
| 🇦🇪 UAE | 3.4 |
| 🇰🇼 Kuwait | 2.7 |
| 🌍 Other | 22.8 |
These three nations have consistently dominated oil production since 1971. The leading position, however, has alternated among them over the past five decades.
In contrast, the combined production of the next three largest producers—Canada, Iraq, and China—reached 13.1 million barrels per day in 2023, just surpassing the production of the United States alone.
In the near term, no country is likely to surpass the record production achieved by the U.S. in 2023, as no other producer has ever reached a daily capacity of 13.0 million barrels. Recently, Saudi Arabia’s state-owned Saudi Aramco scrapped plans to increase production capacity to 13.0 million barrels per day by 2027.
In 2024, analysts forecast that the U.S. will maintain its position as the top oil producer. In fact, according to Macquarie Group, U.S. oil production is expected to achieve a record pace of about 14 million barrels per day by the end of the year.
Energy Shift
How Much Does the U.S. Depend on Russian Uranium?
Despite a new uranium ban being discussed in Congress, the U.S. is still heavily dependent on Russian uranium.

How Much Does the U.S. Depend on Russian Uranium?
This was originally posted on our Voronoi app. Download the app for free on iOS or Android and discover incredible data-driven charts from a variety of trusted sources.
The U.S. House of Representatives recently passed a ban on imports of Russian uranium. The bill must pass the Senate before becoming law.
In this graphic, we visualize how much the U.S. relies on Russian uranium, based on data from the United States Energy Information Administration (EIA).
U.S. Suppliers of Enriched Uranium
After Russia invaded Ukraine, the U.S. imposed sanctions on Russian-produced oil and gas—yet Russian-enriched uranium is still being imported.
Currently, Russia is the largest foreign supplier of nuclear power fuel to the United States. In 2022, Russia supplied almost a quarter of the enriched uranium used to fuel America’s fleet of more than 90 commercial reactors.
| Country of enrichment service | SWU* | % |
|---|---|---|
| 🇺🇸 United States | 3,876 | 27.34% |
| 🇷🇺 Russia | 3,409 | 24.04% |
| 🇩🇪 Germany | 1,763 | 12.40% |
| 🇬🇧 United Kingdom | 1,593 | 11.23% |
| 🇳🇱 Netherlands | 1,303 | 9.20% |
| Other | 2,232 | 15.79% |
| Total | 14,176 | 100% |
SWU stands for “Separative Work Unit” in the uranium industry. It is a measure of the amount of work required to separate isotopes of uranium during the enrichment process. Source: U.S. Energy Information Administration
Most of the remaining uranium is imported from European countries, while another portion is produced by a British-Dutch-German consortium operating in the United States called Urenco.
Similarly, nearly a dozen countries around the world depend on Russia for more than half of their enriched uranium—and many of them are NATO-allied members and allies of Ukraine.
In 2023 alone, the U.S. nuclear industry paid over $800 million to Russia’s state-owned nuclear energy corporation, Rosatom, and its fuel subsidiaries.
It is important to note that 19% of electricity in the U.S. is powered by nuclear plants.
The dependency on Russian fuels dates back to the 1990s when the United States turned away from its own enrichment capabilities in favor of using down-blended stocks of Soviet-era weapons-grade uranium.
As part of the new uranium-ban bill, the Biden administration plans to allocate $2.2 billion for the expansion of uranium enrichment facilities in the United States.

-

 Electrification3 years ago
Ranked: The Top 10 EV Battery Manufacturers
-

 Electrification2 years ago
The Key Minerals in an EV Battery
-

 Real Assets3 years ago
The World’s Top 10 Gold Mining Companies
-

 Misc3 years ago
All the Metals We Mined in One Visualization
-

 Electrification3 years ago
The Biggest Mining Companies in the World in 2021
-

 Energy Shift2 years ago
What Are the Five Major Types of Renewable Energy?
-

 Electrification2 years ago
Mapped: Solar Power by Country in 2021
-

 Electrification2 years ago
The World’s Largest Nickel Mining Companies