

Energy Shift
Visualizing the Products and Fuels Made from Crude Oil


What Products Are Made from a Barrel of Crude Oil?
From the gasoline in our cars to the plastic in countless everyday items, crude oil is an essential raw material that shows up everywhere in our lives.
With around 18 million barrels of crude oil consumed every day just in America, this commodity powers transport, utilities, and is a vital ingredient in many of the things we use on a daily basis.
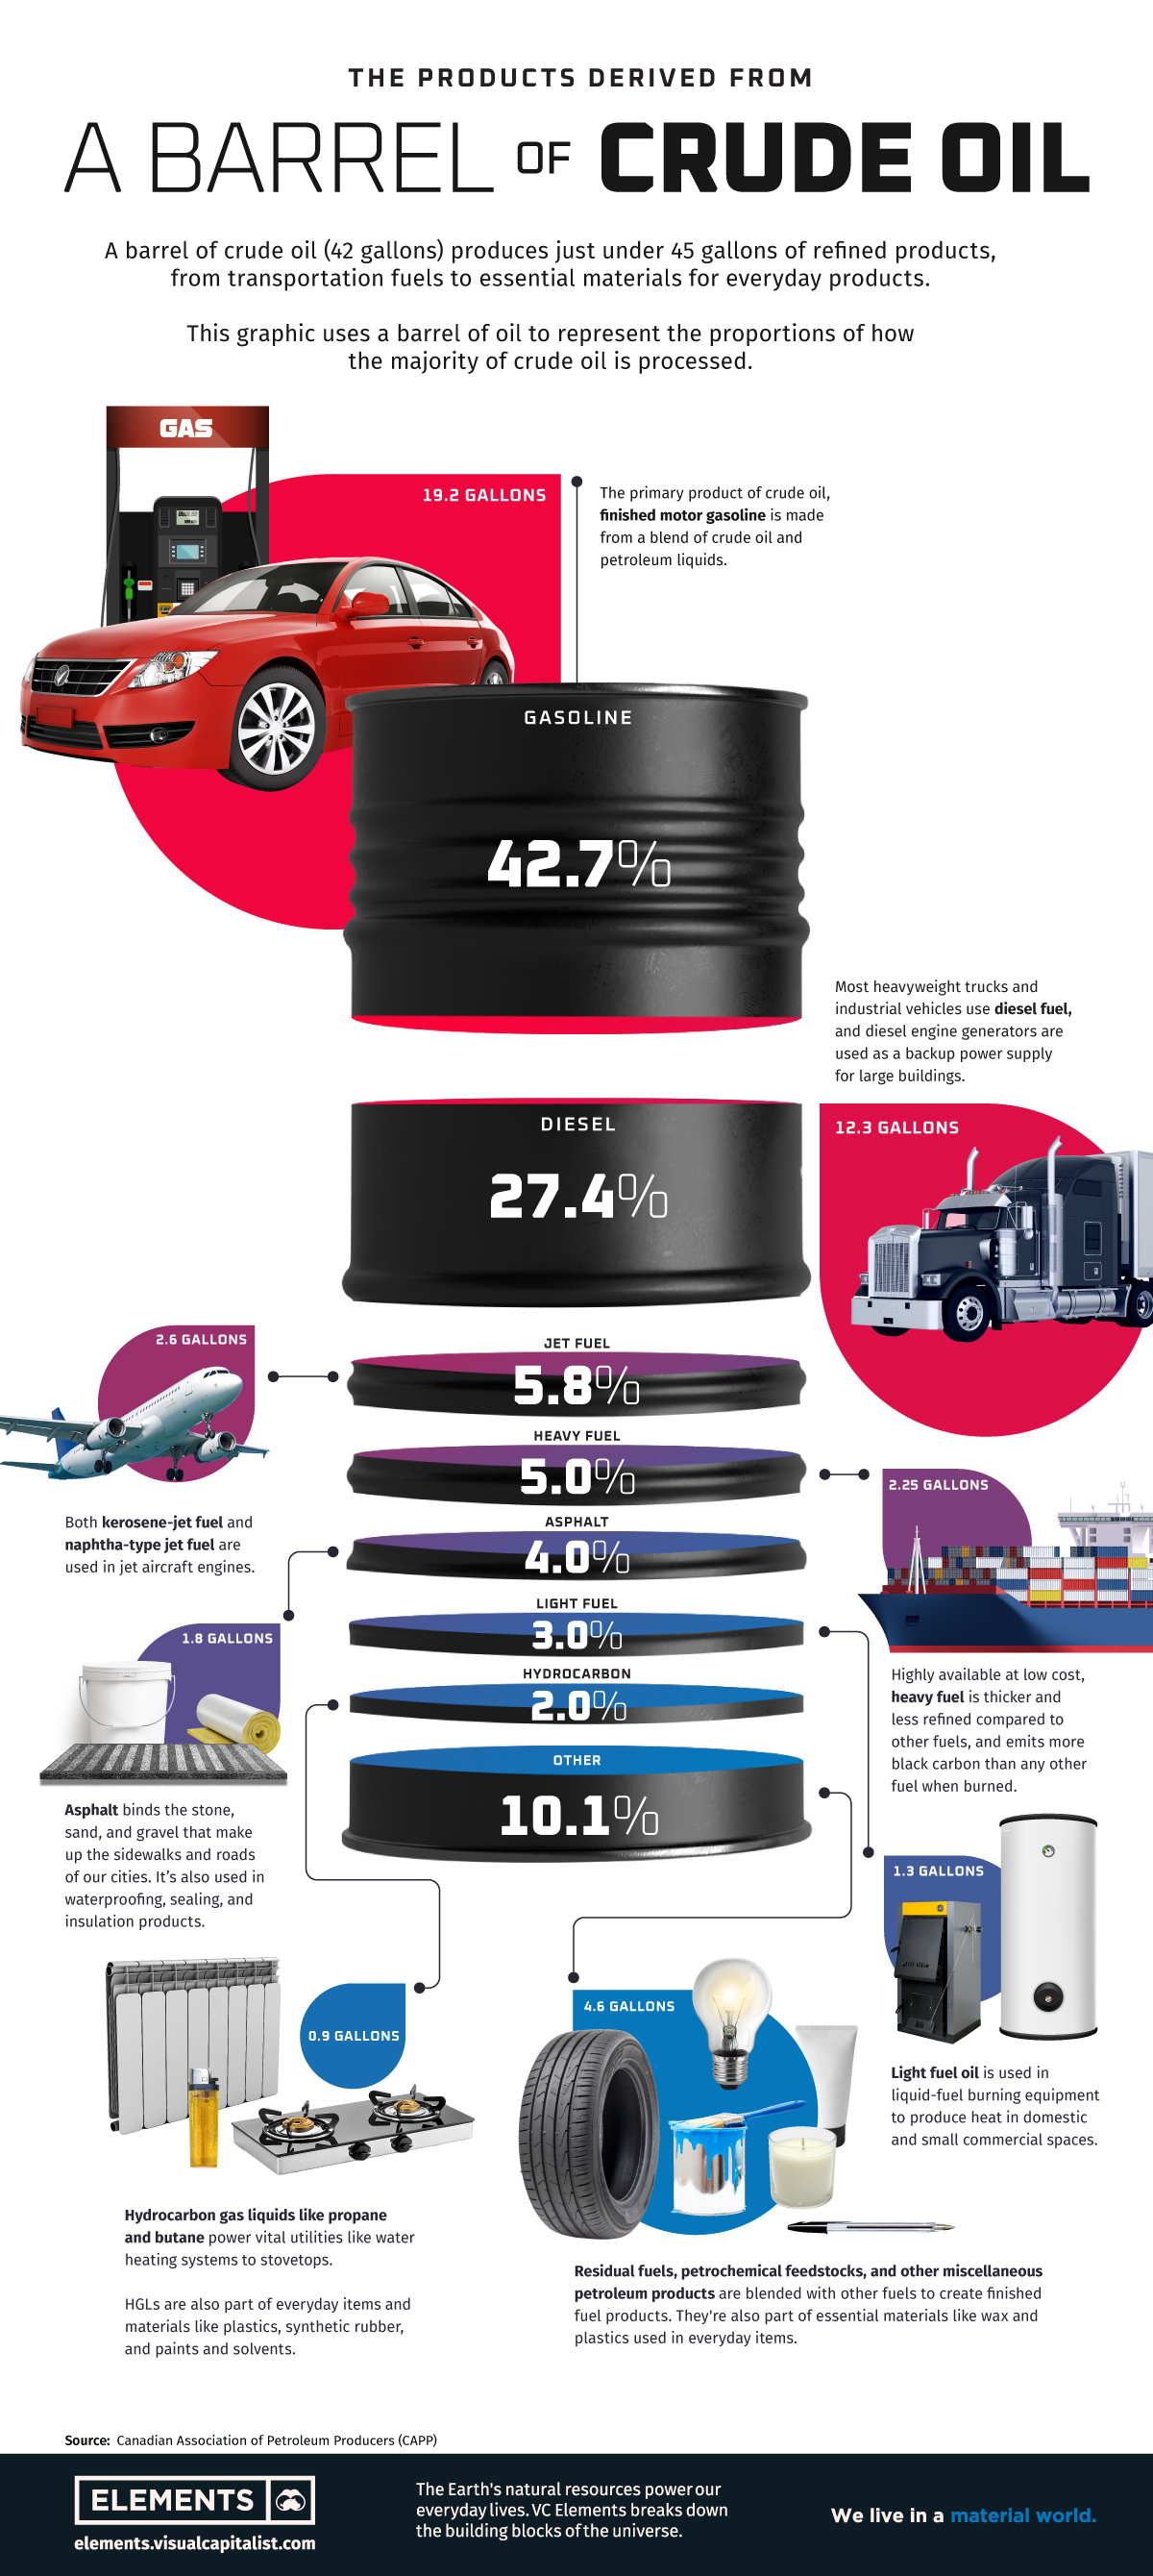
This graphic visualizes how much crude oil is refined into various finished products, using a barrel of oil to represent the proportional breakdown.
From Crude Oil to Functional Fuel and More
Crude oil is primarily refined into various types of fuels to power transport and vital utilities. More than 85% of crude oil is refined into fuels like gasoline, diesel, and hydrocarbon gas liquids (HGLs) like propane and butane.
Along with being fuels for transportation, heating, and cooking, HGLs are used as feedstock for the production of chemicals, plastics, and synthetic rubber, and as additives for motor gasoline production.
| Refined Crude Oil Product | Share of Crude Oil Refined |
|---|---|
| Gasoline | 42.7% |
| Diesel | 27.4% |
| Jet fuel | 5.8% |
| Heavy fuel | 5.0% |
| Asphalt | 4.0% |
| Light fuel | 3.0% |
| Hydrocarbon gas liquids | 2.0% |
| Other | 10.1% |
Source: Canadian Association of Petroleum Producers
Crude oil not only powers our vehicles, but it also helps pave the roads we drive on. About 4% of refined crude oil becomes asphalt, which is used to make concrete and different kinds of sealing and insulation products.
Although transportation and utility fuels dominate a large proportion of refined products, essential everyday materials like wax and plastic are also dependent on crude oil. With about 10% of refined products used to make plastics, cosmetics, and textiles, a barrel of crude oil can produce a variety of unexpected everyday products.
Personal care products like cosmetics and shampoo are made using petroleum products, as are medical supplies like IV bags and pharmaceuticals. Modern life would look very different without crude oil.
The Process of Refining Crude Oil
You might have noticed that while a barrel of crude oil contains 42 gallons, it ends up producing 45 gallons of refined products. This is because the majority of refined products have a lower density than crude oil, resulting in an increase in volume that is called processing gain.
Along with this, there are other inputs aside from crude oil that are used in the refining process. While crude oil is the primary input, fuel ethanol, hydrocarbon gas liquids, and other blending liquids are also used.
| U.S. Refiner and Blender Inputs | Share of Total |
|---|---|
| Crude oil | 85.4% |
| Fuel ethanol | 4.8% |
| Blending components | 3.5% |
| Hydrocarbon gas liquids | 3.0% |
| Other liquids | 3.3% |
Source: EIA
The process of refining a 30,000-barrel batch of crude oil typically takes between 12-24 hours, with refineries operating 24 hours a day, 365 days a year. Although the proportions of individual refined products can vary depending on market demand and other factors, the majority of crude oil will continue to become fuel for the world’s transport and utilities.
The Difficulty of Cutting Down on Crude Oil
From the burning of heavy fuels tarnishing icebergs found in Arctic waters to the mounds of plastic made with petrochemicals that end up in our rivers, crude oil and its refined products impact our environment in many different ways.
But even as the world works to reduce its consumption of fossil fuels in order to reach climate goals, a world without crude oil seems unfathomable.
Skyrocketing sales of EVs still haven’t managed to curb petroleum consumption in places like Norway, California, and China, and the steady reopening of travel and the economy will only result in increased petroleum consumption.
Completely replacing the multi-faceted “black gold” that is crude oil isn’t possible right now, but as electrification continues and we find alternatives to petrochemical materials, humanity might at least manage to reduce its dependence on burning fossil fuels.


Energy Shift
The World’s Biggest Oil Producers in 2023
Just three countries accounted for 40% of global oil production last year.

The World’s Biggest Oil Producers in 2023
This was originally posted on our Voronoi app. Download the app for free on iOS or Android and discover incredible data-driven charts from a variety of trusted sources.
Despite efforts to decarbonize the global economy, oil still remains one of the world’s most important resources. It’s also produced by a fairly limited group of countries, which can be a source of economic and political leverage.
This graphic illustrates global crude oil production in 2023, measured in million barrels per day, sourced from the U.S. Energy Information Administration (EIA).
Three Countries Account for 40% of Global Oil Production
In 2023, the United States, Russia, and Saudi Arabia collectively contributed 32.7 million barrels per day to global oil production.
| Oil Production 2023 | Million barrels per day |
|---|---|
| 🇺🇸 U.S. | 12.9 |
| 🇷🇺 Russia | 10.1 |
| 🇸🇦 Saudi Arabia | 9.7 |
| 🇨🇦 Canada | 4.6 |
| 🇮🇶 Iraq | 4.3 |
| 🇨🇳 China | 4.2 |
| 🇮🇷 Iran | 3.6 |
| 🇧🇷 Brazil | 3.4 |
| 🇦🇪 UAE | 3.4 |
| 🇰🇼 Kuwait | 2.7 |
| 🌍 Other | 22.8 |
These three nations have consistently dominated oil production since 1971. The leading position, however, has alternated among them over the past five decades.
In contrast, the combined production of the next three largest producers—Canada, Iraq, and China—reached 13.1 million barrels per day in 2023, just surpassing the production of the United States alone.
In the near term, no country is likely to surpass the record production achieved by the U.S. in 2023, as no other producer has ever reached a daily capacity of 13.0 million barrels. Recently, Saudi Arabia’s state-owned Saudi Aramco scrapped plans to increase production capacity to 13.0 million barrels per day by 2027.
In 2024, analysts forecast that the U.S. will maintain its position as the top oil producer. In fact, according to Macquarie Group, U.S. oil production is expected to achieve a record pace of about 14 million barrels per day by the end of the year.
Energy Shift
How Much Does the U.S. Depend on Russian Uranium?
Despite a new uranium ban being discussed in Congress, the U.S. is still heavily dependent on Russian uranium.

How Much Does the U.S. Depend on Russian Uranium?
This was originally posted on our Voronoi app. Download the app for free on iOS or Android and discover incredible data-driven charts from a variety of trusted sources.
The U.S. House of Representatives recently passed a ban on imports of Russian uranium. The bill must pass the Senate before becoming law.
In this graphic, we visualize how much the U.S. relies on Russian uranium, based on data from the United States Energy Information Administration (EIA).
U.S. Suppliers of Enriched Uranium
After Russia invaded Ukraine, the U.S. imposed sanctions on Russian-produced oil and gas—yet Russian-enriched uranium is still being imported.
Currently, Russia is the largest foreign supplier of nuclear power fuel to the United States. In 2022, Russia supplied almost a quarter of the enriched uranium used to fuel America’s fleet of more than 90 commercial reactors.
| Country of enrichment service | SWU* | % |
|---|---|---|
| 🇺🇸 United States | 3,876 | 27.34% |
| 🇷🇺 Russia | 3,409 | 24.04% |
| 🇩🇪 Germany | 1,763 | 12.40% |
| 🇬🇧 United Kingdom | 1,593 | 11.23% |
| 🇳🇱 Netherlands | 1,303 | 9.20% |
| Other | 2,232 | 15.79% |
| Total | 14,176 | 100% |
SWU stands for “Separative Work Unit” in the uranium industry. It is a measure of the amount of work required to separate isotopes of uranium during the enrichment process. Source: U.S. Energy Information Administration
Most of the remaining uranium is imported from European countries, while another portion is produced by a British-Dutch-German consortium operating in the United States called Urenco.
Similarly, nearly a dozen countries around the world depend on Russia for more than half of their enriched uranium—and many of them are NATO-allied members and allies of Ukraine.
In 2023 alone, the U.S. nuclear industry paid over $800 million to Russia’s state-owned nuclear energy corporation, Rosatom, and its fuel subsidiaries.
It is important to note that 19% of electricity in the U.S. is powered by nuclear plants.
The dependency on Russian fuels dates back to the 1990s when the United States turned away from its own enrichment capabilities in favor of using down-blended stocks of Soviet-era weapons-grade uranium.
As part of the new uranium-ban bill, the Biden administration plans to allocate $2.2 billion for the expansion of uranium enrichment facilities in the United States.

-

 Electrification3 years ago
Ranked: The Top 10 EV Battery Manufacturers
-

 Electrification2 years ago
The Key Minerals in an EV Battery
-

 Real Assets3 years ago
The World’s Top 10 Gold Mining Companies
-

 Misc3 years ago
All the Metals We Mined in One Visualization
-

 Electrification3 years ago
The Biggest Mining Companies in the World in 2021
-

 Energy Shift2 years ago
What Are the Five Major Types of Renewable Energy?
-

 Electrification2 years ago
Mapped: Solar Power by Country in 2021
-

 Electrification2 years ago
The World’s Largest Nickel Mining Companies