

Energy Shift
Visualized: How the Oil and Gas Industry Spends Its Profits
How the Oil and Gas Industry Spends Its Profits
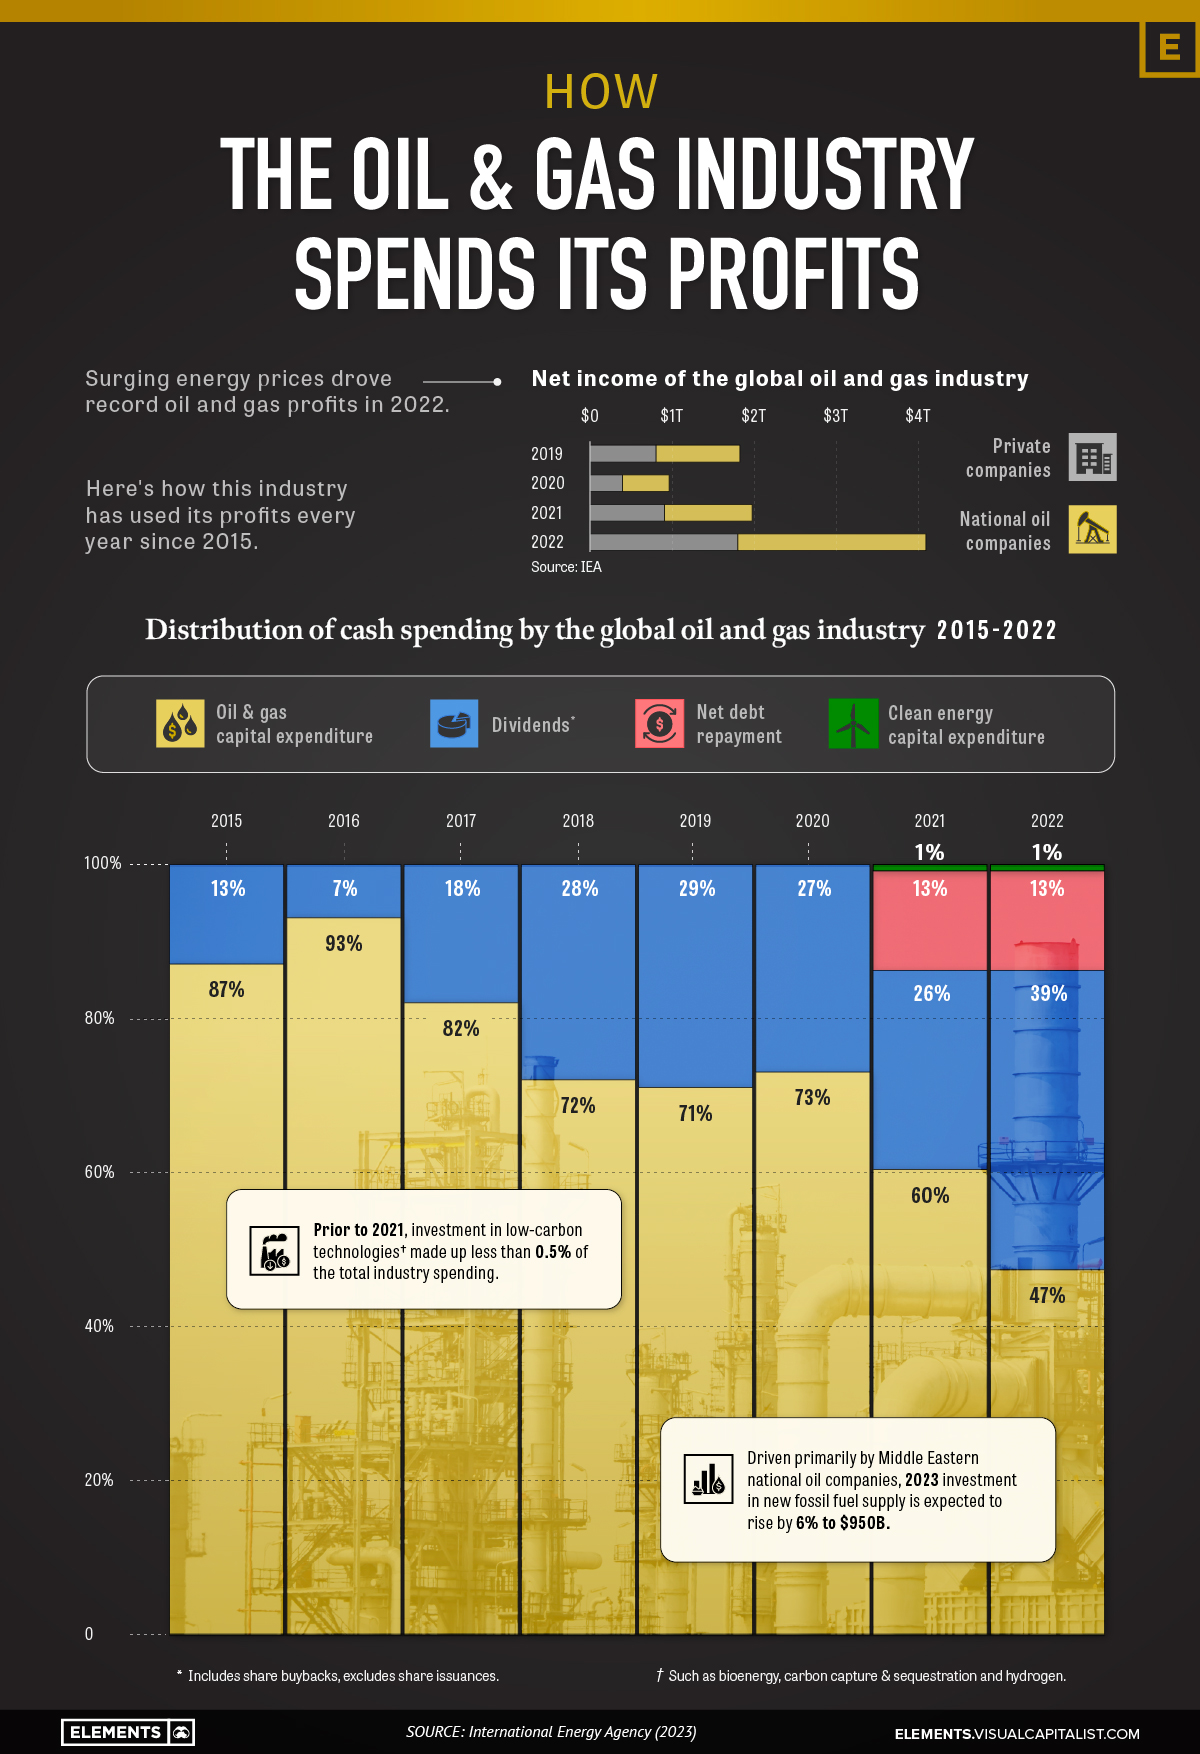
2022 was a highly profitable year for the oil and gas industry. Due to Russia’s invasion of Ukraine, energy prices skyrocketed, and the industry amassed an astounding $4 trillion in profits.
So, how were these 2022 profits spent? And how does this spending compare to previous years?
To find out, we’ve visualized the distribution of cash spending by the global oil and gas industry between 2015 and 2022, according to the International Energy Agency’s 2023 World Energy Investment report.
Distribution of Cash Spending: 2015-2022
Unlike previous years, a majority of the oil and gas industry’s 2022 profits were channeled towards enhancing shareholder dividends and reducing debt burdens.
This means that capital expenditure for oil and gas production dropped below 50% of total spending for the first time in more than 15 years.
| Distribution of Spending | 2015 | 2016 | 2017 | 2018 | 2019 | 2020 | 2021 | 2022 |
|---|---|---|---|---|---|---|---|---|
| Oil and gas capital expenditure | 87% | 93% | 82% | 72% | 71% | 73% | 60% | 47% |
| Clean energy capital expenditure | 0% | 0% | 0% | 0% | 0% | 0% | 1% | 1% |
| Dividends* | 13% | 7% | 18% | 28% | 29% | 27% | 26% | 39% |
| Net debt repayment | 0% | 0% | 0% | 0% | 0% | 0% | 13% | 13% |
| TOTAL | 100% | 100% | 100% | 100% | 100% | 100% | 100% | 100% |
*Dividends include share buybacks, exclude share issuances.
Shareholder pressures for greater returns, as well as long-term demand and cost concerns, were primary reasons for the reshaping of this spending.
Conversely, even with the continued demands for the sector to contribute more to addressing climate change, cash flow allocated to clean energy remained around 1% of spending.
Subnational Spending Trends
The International Energy Agency (IEA) predicts that expenditure on new fossil fuel supply will experience a 6% increase in 2023, reaching a total of $950 billion.
While this refers to global numbers, noteworthy disparities do exist based on geographical location and different types of oil and gas companies, including:
- Most of the growth in new supply expenditure is expected to come from Middle Eastern national oil companies. Based on their announced spending, they are the only subset in the industry that is planning to spend significantly more in 2023 than in 2022.
- Real spending on oil and gas supply continues to fall short of 2019 levels for a majority of North American and European companies.
- While only making up 1% of total spending in 2022, investment in carbon capture, utilization, and storage (CCUS), hydrogen, and bioenergy are growing in the industry. Most of these projects are led by major private players, along with national oil companies from Europe and North America.
What About the Energy Transition?
While there are shifts in the oil and gas industry’s spending, it’s important to note that current capital expenditures in fossil fuels are more than double what is required to achieve the IEA’s 2050 Net Zero Emissions Scenario.
Therefore, more meaningful and substantial shifts in spending are necessary to bring down the emissions of the sector.


Energy Shift
The World’s Biggest Oil Producers in 2023
Just three countries accounted for 40% of global oil production last year.

The World’s Biggest Oil Producers in 2023
This was originally posted on our Voronoi app. Download the app for free on iOS or Android and discover incredible data-driven charts from a variety of trusted sources.
Despite efforts to decarbonize the global economy, oil still remains one of the world’s most important resources. It’s also produced by a fairly limited group of countries, which can be a source of economic and political leverage.
This graphic illustrates global crude oil production in 2023, measured in million barrels per day, sourced from the U.S. Energy Information Administration (EIA).
Three Countries Account for 40% of Global Oil Production
In 2023, the United States, Russia, and Saudi Arabia collectively contributed 32.7 million barrels per day to global oil production.
| Oil Production 2023 | Million barrels per day |
|---|---|
| 🇺🇸 U.S. | 12.9 |
| 🇷🇺 Russia | 10.1 |
| 🇸🇦 Saudi Arabia | 9.7 |
| 🇨🇦 Canada | 4.6 |
| 🇮🇶 Iraq | 4.3 |
| 🇨🇳 China | 4.2 |
| 🇮🇷 Iran | 3.6 |
| 🇧🇷 Brazil | 3.4 |
| 🇦🇪 UAE | 3.4 |
| 🇰🇼 Kuwait | 2.7 |
| 🌍 Other | 22.8 |
These three nations have consistently dominated oil production since 1971. The leading position, however, has alternated among them over the past five decades.
In contrast, the combined production of the next three largest producers—Canada, Iraq, and China—reached 13.1 million barrels per day in 2023, just surpassing the production of the United States alone.
In the near term, no country is likely to surpass the record production achieved by the U.S. in 2023, as no other producer has ever reached a daily capacity of 13.0 million barrels. Recently, Saudi Arabia’s state-owned Saudi Aramco scrapped plans to increase production capacity to 13.0 million barrels per day by 2027.
In 2024, analysts forecast that the U.S. will maintain its position as the top oil producer. In fact, according to Macquarie Group, U.S. oil production is expected to achieve a record pace of about 14 million barrels per day by the end of the year.
Energy Shift
How Much Does the U.S. Depend on Russian Uranium?
Despite a new uranium ban being discussed in Congress, the U.S. is still heavily dependent on Russian uranium.

How Much Does the U.S. Depend on Russian Uranium?
This was originally posted on our Voronoi app. Download the app for free on iOS or Android and discover incredible data-driven charts from a variety of trusted sources.
The U.S. House of Representatives recently passed a ban on imports of Russian uranium. The bill must pass the Senate before becoming law.
In this graphic, we visualize how much the U.S. relies on Russian uranium, based on data from the United States Energy Information Administration (EIA).
U.S. Suppliers of Enriched Uranium
After Russia invaded Ukraine, the U.S. imposed sanctions on Russian-produced oil and gas—yet Russian-enriched uranium is still being imported.
Currently, Russia is the largest foreign supplier of nuclear power fuel to the United States. In 2022, Russia supplied almost a quarter of the enriched uranium used to fuel America’s fleet of more than 90 commercial reactors.
| Country of enrichment service | SWU* | % |
|---|---|---|
| 🇺🇸 United States | 3,876 | 27.34% |
| 🇷🇺 Russia | 3,409 | 24.04% |
| 🇩🇪 Germany | 1,763 | 12.40% |
| 🇬🇧 United Kingdom | 1,593 | 11.23% |
| 🇳🇱 Netherlands | 1,303 | 9.20% |
| Other | 2,232 | 15.79% |
| Total | 14,176 | 100% |
SWU stands for “Separative Work Unit” in the uranium industry. It is a measure of the amount of work required to separate isotopes of uranium during the enrichment process. Source: U.S. Energy Information Administration
Most of the remaining uranium is imported from European countries, while another portion is produced by a British-Dutch-German consortium operating in the United States called Urenco.
Similarly, nearly a dozen countries around the world depend on Russia for more than half of their enriched uranium—and many of them are NATO-allied members and allies of Ukraine.
In 2023 alone, the U.S. nuclear industry paid over $800 million to Russia’s state-owned nuclear energy corporation, Rosatom, and its fuel subsidiaries.
It is important to note that 19% of electricity in the U.S. is powered by nuclear plants.
The dependency on Russian fuels dates back to the 1990s when the United States turned away from its own enrichment capabilities in favor of using down-blended stocks of Soviet-era weapons-grade uranium.
As part of the new uranium-ban bill, the Biden administration plans to allocate $2.2 billion for the expansion of uranium enrichment facilities in the United States.

-

 Electrification3 years ago
Ranked: The Top 10 EV Battery Manufacturers
-

 Electrification2 years ago
The Key Minerals in an EV Battery
-

 Real Assets3 years ago
The World’s Top 10 Gold Mining Companies
-

 Misc3 years ago
All the Metals We Mined in One Visualization
-

 Electrification3 years ago
The Biggest Mining Companies in the World in 2021
-

 Energy Shift2 years ago
What Are the Five Major Types of Renewable Energy?
-

 Electrification2 years ago
Mapped: Solar Power by Country in 2021
-

 Electrification2 years ago
The World’s Largest Nickel Mining Companies