

Electrification
Chart: The $400 Billion Lithium Battery Value Chain
The following content is sponsored by the EnergyX
Breaking Down the $400 Billion Battery Value Chain
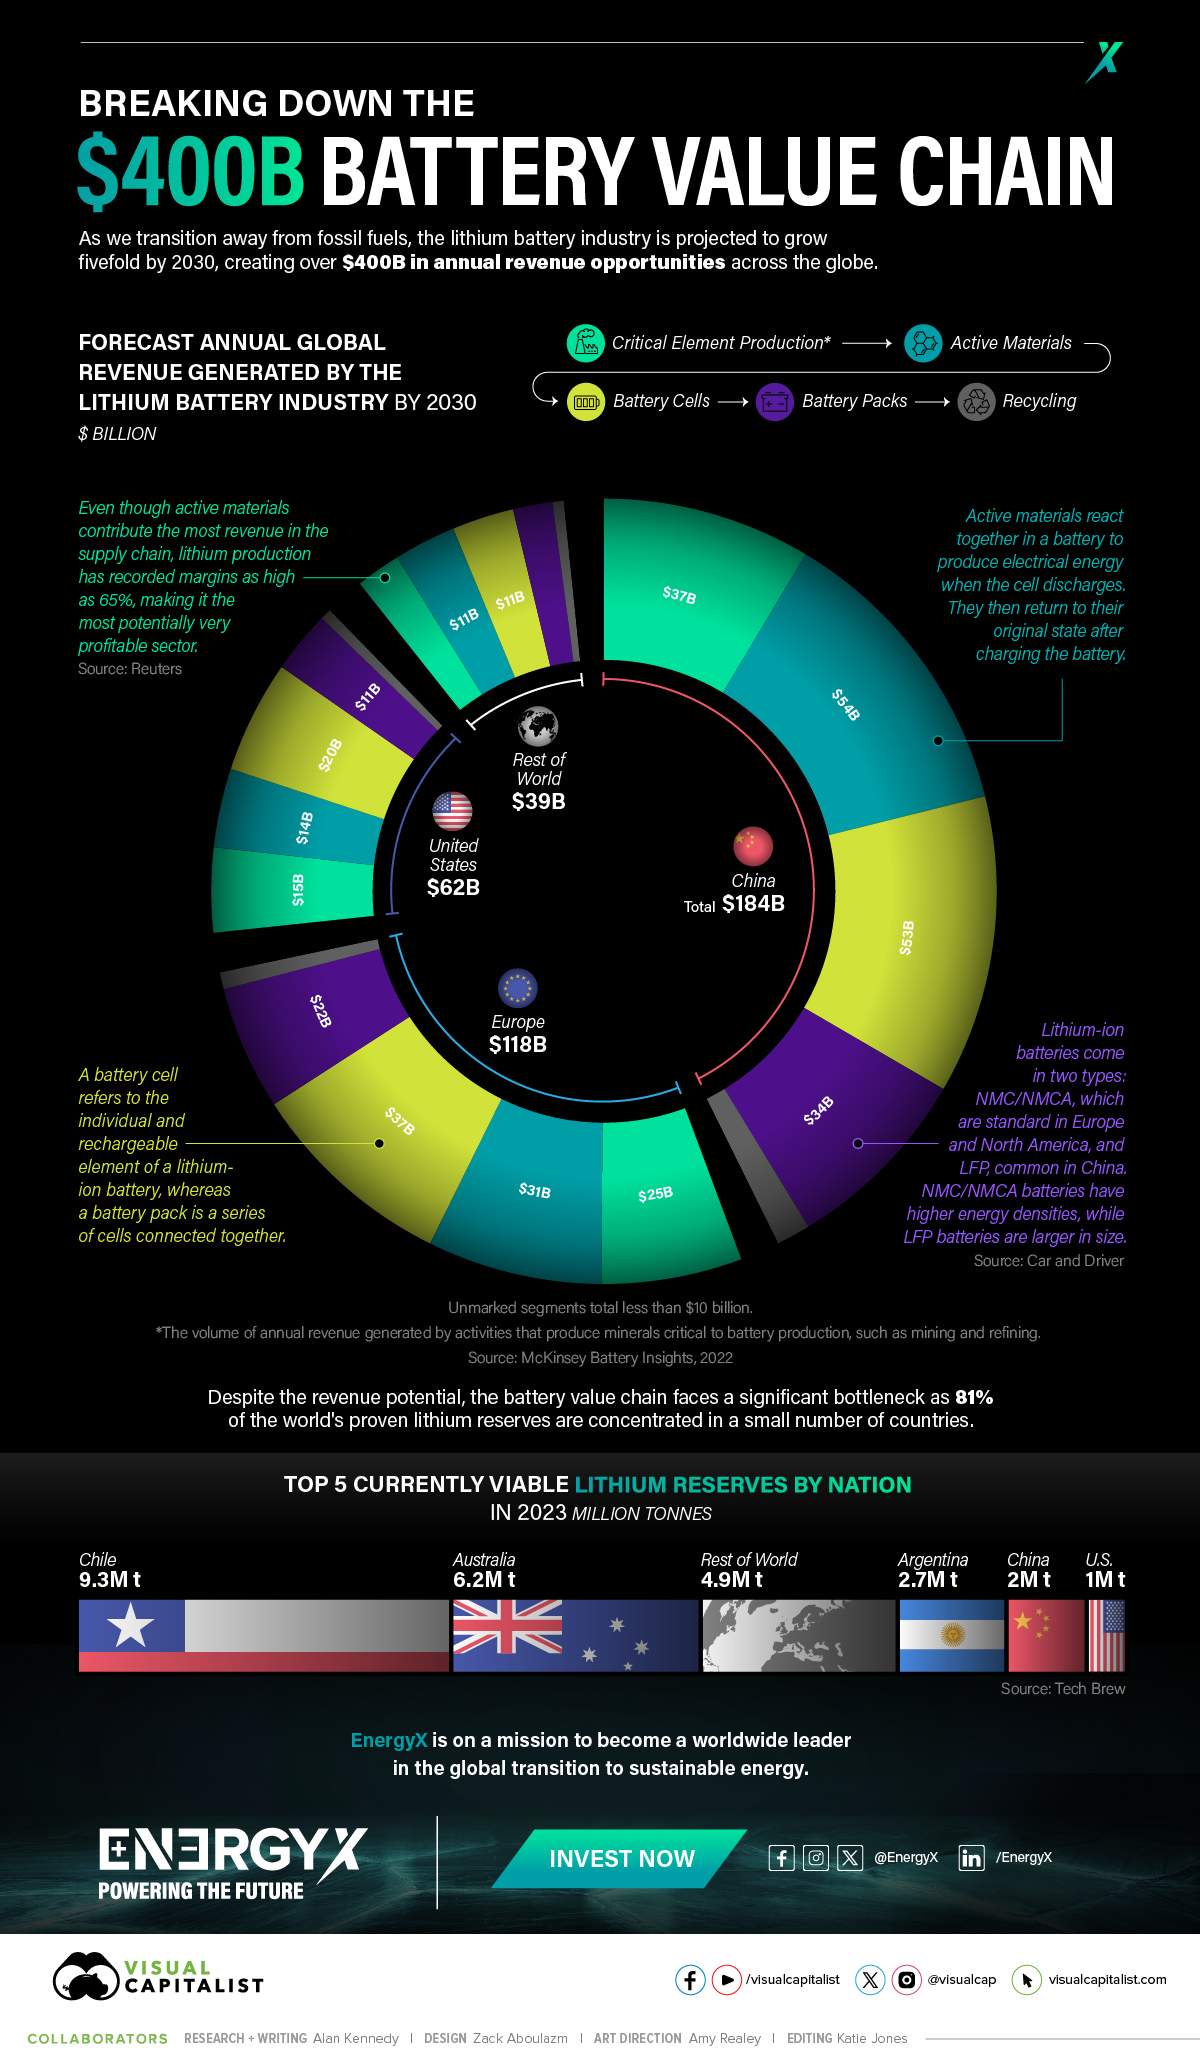
As the world transitions away from fossil fuels toward a greener future, the lithium battery industry could grow fivefold by 2030. This shift could create over $400 billion in annual revenue opportunities globally.
For this graphic, we partnered with EnergyX to determine how the battery industry could grow by 2030.
Exploring the Battery Value Chain
The lithium battery value chain has many links within it that each generate their own revenue opportunities, these include:
- Critical Element Production: Involves the mining and refining of materials used in a battery’s construction.
- Active materials: Creating and developing materials that react electrochemically to allow batteries to charge and discharge.
- Battery cells: Involves the production of rechargeable elements of a battery.
- Battery packs: Producing packs containing a series of connected battery cells. Generally, these come in two types: NMC/NMCA, the standard in North America and Europe, and LFP, the standard in China.
- Recycling: Reusing battery components within new batteries.
But these links aren’t equal, each one is projected to generate different levels of revenue by 2030:
| China 🇨🇳 | Europe 🇪🇺 | United States 🇺🇸 | Rest of World 🌍 | |
|---|---|---|---|---|
| Total | $184B | $118B | $62B | $39B |
| Critical Element Production | $37B | $25B | $15B | $8B |
| Active Materials | $54B | $31B | $14B | $11B |
| Battery Packs | $34B | $22B | $11B | $7B |
| Battery Cells | $53B | $37B | $20B | $11B |
| Recycling | $6B | $3B | $2B | $2B |
On the surface, battery cell production may contribute the most revenue to the battery value chain. However, lithium production can generate margins as high as 65%, meaning lithium production has potential to yield large margins.
How Much Lithium Is Available?
Just a few countries hold 81% of the world’s viable lithium. So, supply bottlenecks could slow the growth of the lithium battery industry:
| Nation | Viable Lithium Reserves (2023) |
|---|---|
| Chile 🇨🇱 | 9.3M t |
| Australia 🇦🇺 | 6.2M t |
| Argentina 🇦🇷 | 2.7M t |
| China 🇨🇳 | 2M t |
| U.S. 🇺🇸 | 1M t |
| Rest of World 🌍 | 4.9M t |
Supplying the World With Batteries
Supplying the world with lithium is critical to the battery value chain and a successful transition from fossil fuels. Players like the U.S. and the EU, with increasingly large and growing lithium needs, will need to maximize local opportunities and work together to meet demand.
EnergyX is on a mission to become a world leader in the global transition to sustainable energy, using cutting-edge direct lithium extraction to help supply the world with lithium.


Electrification
Ranked: The Top 10 EV Battery Manufacturers in 2023
Asia dominates this ranking of the world’s largest EV battery manufacturers in 2023.

The Top 10 EV Battery Manufacturers in 2023
This was originally posted on our Voronoi app. Download the app for free on iOS or Android and discover incredible data-driven charts from a variety of trusted sources.
Despite efforts from the U.S. and EU to secure local domestic supply, all major EV battery manufacturers remain based in Asia.
In this graphic we rank the top 10 EV battery manufacturers by total battery deployment (measured in megawatt-hours) in 2023. The data is from EV Volumes.
Chinese Dominance
Contemporary Amperex Technology Co. Limited (CATL) has swiftly risen in less than a decade to claim the title of the largest global battery group.
The Chinese company now has a 34% share of the market and supplies batteries to a range of made-in-China vehicles, including the Tesla Model Y, SAIC’s MG4/Mulan, and Li Auto models.
| Company | Country | 2023 Production (megawatt-hour) | Share of Total Production |
|---|---|---|---|
| CATL | 🇨🇳China | 242,700 | 34% |
| BYD | 🇨🇳China | 115,917 | 16% |
| LG Energy Solution | 🇰🇷Korea | 108,487 | 15% |
| Panasonic | 🇯🇵Japan | 56,560 | 8% |
| SK On | 🇰🇷Korea | 40,711 | 6% |
| Samsung SDI | 🇰🇷Korea | 35,703 | 5% |
| CALB | 🇨🇳China | 23,493 | 3% |
| Farasis Energy | 🇨🇳China | 16,527 | 2% |
| Envision AESC | 🇨🇳China | 8,342 | 1% |
| Sunwoda | 🇨🇳China | 6,979 | 1% |
| Other | - | 56,040 | 8% |
In 2023, BYD surpassed LG Energy Solution to claim second place. This was driven by demand from its own models and growth in third-party deals, including providing batteries for the made-in-Germany Tesla Model Y, Toyota bZ3, Changan UNI-V, Venucia V-Online, as well as several Haval and FAW models.
The top three battery makers (CATL, BYD, LG) collectively account for two-thirds (66%) of total battery deployment.
Once a leader in the EV battery business, Panasonic now holds the fourth position with an 8% market share, down from 9% last year. With its main client, Tesla, now effectively sourcing batteries from multiple suppliers, the Japanese battery maker seems to be losing its competitive edge in the industry.
Overall, the global EV battery market size is projected to grow from $49 billion in 2022 to $98 billion by 2029, according to Fortune Business Insights.
Electrification
White Gold: Mapping U.S. Lithium Mines
In this graphic, Visual Capitalist partnerered with EnergyX to explore the size and location of U.S. lithium mines.

White Gold: Mapping U.S. Lithium Mines
The U.S. doubled imports of lithium-ion batteries for the third consecutive year in 2022, and with EV demand growing yearly, U.S. lithium mines must ramp up production or rely on other nations for their supply of refined lithium.
To determine if the domestic U.S. lithium opportunity can meet demand, we partnered with EnergyX to determine how much lithium sits within U.S. borders.
U.S. Lithium Projects
The most crucial measure of a lithium mine’s potential is the quantity that can be extracted from the source.
For each lithium resource, the potential volume of lithium carbonate equivalent (LCE) was calculated with a ratio of one metric ton of lithium producing 5.32 metric tons of LCE. Cumulatively, existing U.S. lithium projects contain 94.8 million metric tons of LCE.
| Rank | Project Name | LCE, million metric tons (est.) |
|---|---|---|
| 1 | McDermitt Caldera | 21.5 |
| 2 | Thacker Pass | 19.1 |
| 3 | Tonopah Flats | 18.0 |
| 4 | TLC Lithium | 10.7 |
| 5 | Clayton Valley (Century Lithium) | 6.3 |
| 6 | Zeus Lithium | 6.3 |
| 7 | Rhyolite Ridge | 3.4 |
| 8 | Arkansas Smackover (Phase 1A) | 2.8 |
| 9 | Basin Project | 2.2 |
| 10 | McGee Deposit | 2.1 |
| 11 | Arkansas Smackover (South West) | 1.8 |
| 12 | Clayton Valley (Lithium-X, Pure Energy) | 0.8 |
| 13 | Big Sandy | 0.3 |
| 14 | Imperial Valley/Salton Sea | 0.3 |
U.S. Lithium Opportunities, By State
U.S. lithium projects mainly exist in western states, with comparatively minor opportunities in central or eastern states.
| State | LCE, million metric tons (est.) |
|---|---|
| Nevada | 88.2 |
| Arkansas | 4.6 |
| Arizona | 2.5 |
| California | 0.3 |
Currently, the U.S. is sitting on a wealth of lithium that it is underutilizing. For context, in 2022, the U.S. only produced about 5,000 metric tons of LCE and imported a projected 19,000 metric tons of LCE, showing that the demand for the mineral is healthy.
The Next Gold Rush?
U.S. lithium companies have the opportunity to become global leaders in lithium production and accelerate the transition to sustainable energy sources. This is particularly important as the demand for lithium is increasing every year.
EnergyX is on a mission to meet U.S. lithium demands using groundbreaking technology that can extract 300% more lithium from a source than traditional methods.
You can take advantage of this opportunity by investing in EnergyX and joining other significant players like GM in becoming a shareholder.


-

 Electrification3 years ago
Ranked: The Top 10 EV Battery Manufacturers
-

 Electrification2 years ago
The Key Minerals in an EV Battery
-

 Real Assets3 years ago
The World’s Top 10 Gold Mining Companies
-

 Misc3 years ago
All the Metals We Mined in One Visualization
-

 Electrification3 years ago
The Biggest Mining Companies in the World in 2021
-

 Energy Shift2 years ago
What Are the Five Major Types of Renewable Energy?
-

 Electrification2 years ago
Mapped: Solar Power by Country in 2021
-

 Electrification2 years ago
The World’s Largest Nickel Mining Companies