

Asia dominates this ranking of the world's largest EV battery manufacturers in 2023.
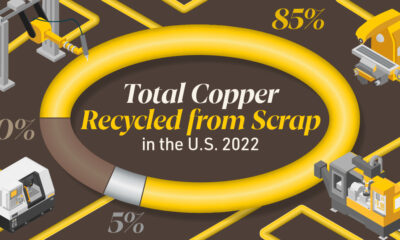

This graphic shows why brass rods are the secure choice for precision-machined and forged parts.


While gold prices hit all-time highs, gold mining stocks have lagged far behind.


From airbags to firefighting equipment, components made from brass rods play a vital role in creating a safer environment.


Just three countries accounted for 40% of global oil production last year.
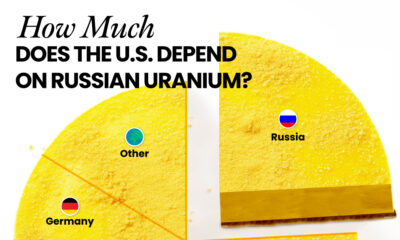

Despite a new uranium ban being discussed in Congress, the U.S. is still heavily dependent on Russian uranium.


Over the last decade, the U.S. has surpassed Saudi Arabia and Russia as the world's top producer of crude oil.
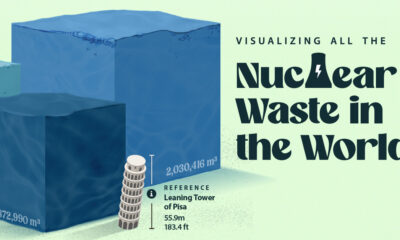

Despite concerns about nuclear waste, high-level radioactive waste constitutes less than 0.25% of all radioactive waste ever generated.
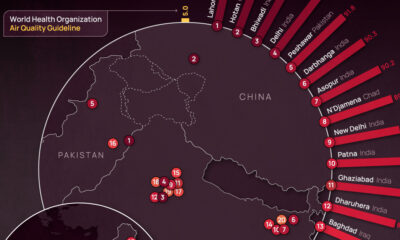

Using 2022 average PM2.5 concentrations, we rank the most polluted cities in the world.
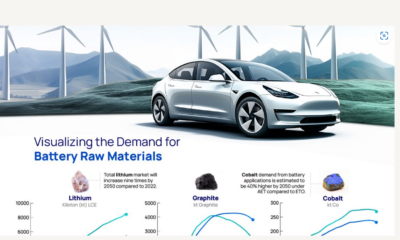

An accelerated energy transition would propel demand for metals such as graphite, lithium, and nickel.