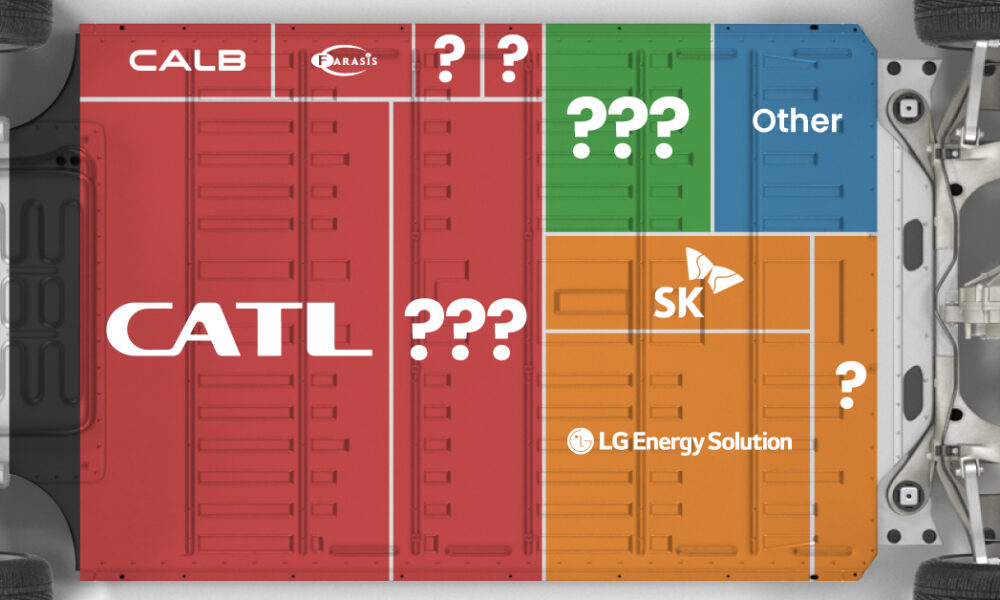
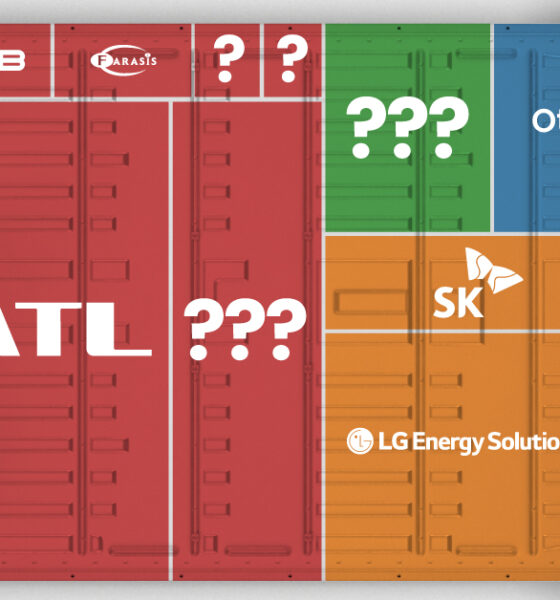
Asia dominates this ranking of the world's largest EV battery manufacturers in 2023.


In this graphic, Visual Capitalist partnerered with EnergyX to explore the size and location of U.S. lithium mines.


Visual Capitalist and EnergyX explore how direct lithium extraction could disrupt the $90B lithium industry.


In this graphic, we break down where the $400 billion lithium battery industry will generate revenue in 2030.


An accelerated energy transition would propel demand for metals such as graphite, lithium, and nickel.


Lithium-ion batteries are critical for many modern technologies, from smartphones to smart cities. Here's how this critical technology works.
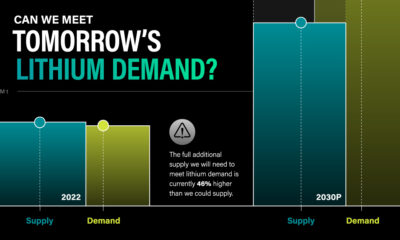

This graphic shows that demand for lithium will outstrip supply by 46%. But direct lithium extraction could be a solution to this problem.
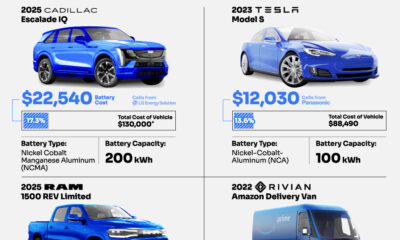

The cost of electric vehicle batteries can vary based on size and chemical composition. Here are the battery costs of six popular EV models.
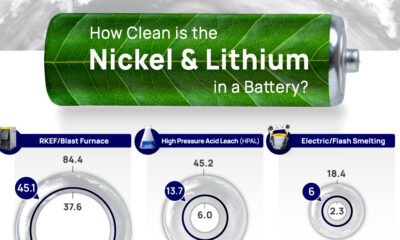

This graphic from Wood Mackenzie shows how nickel and lithium mining can significantly impact the environment, depending on the processes used.
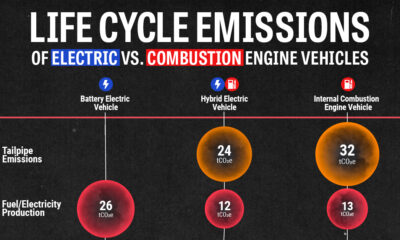

We look at carbon emissions of electric, hybrid, and combustion engine vehicles through an analysis of their life cycle emissions.


