

Electrification
Visualized: What is the Cost of Electric Vehicle Batteries?
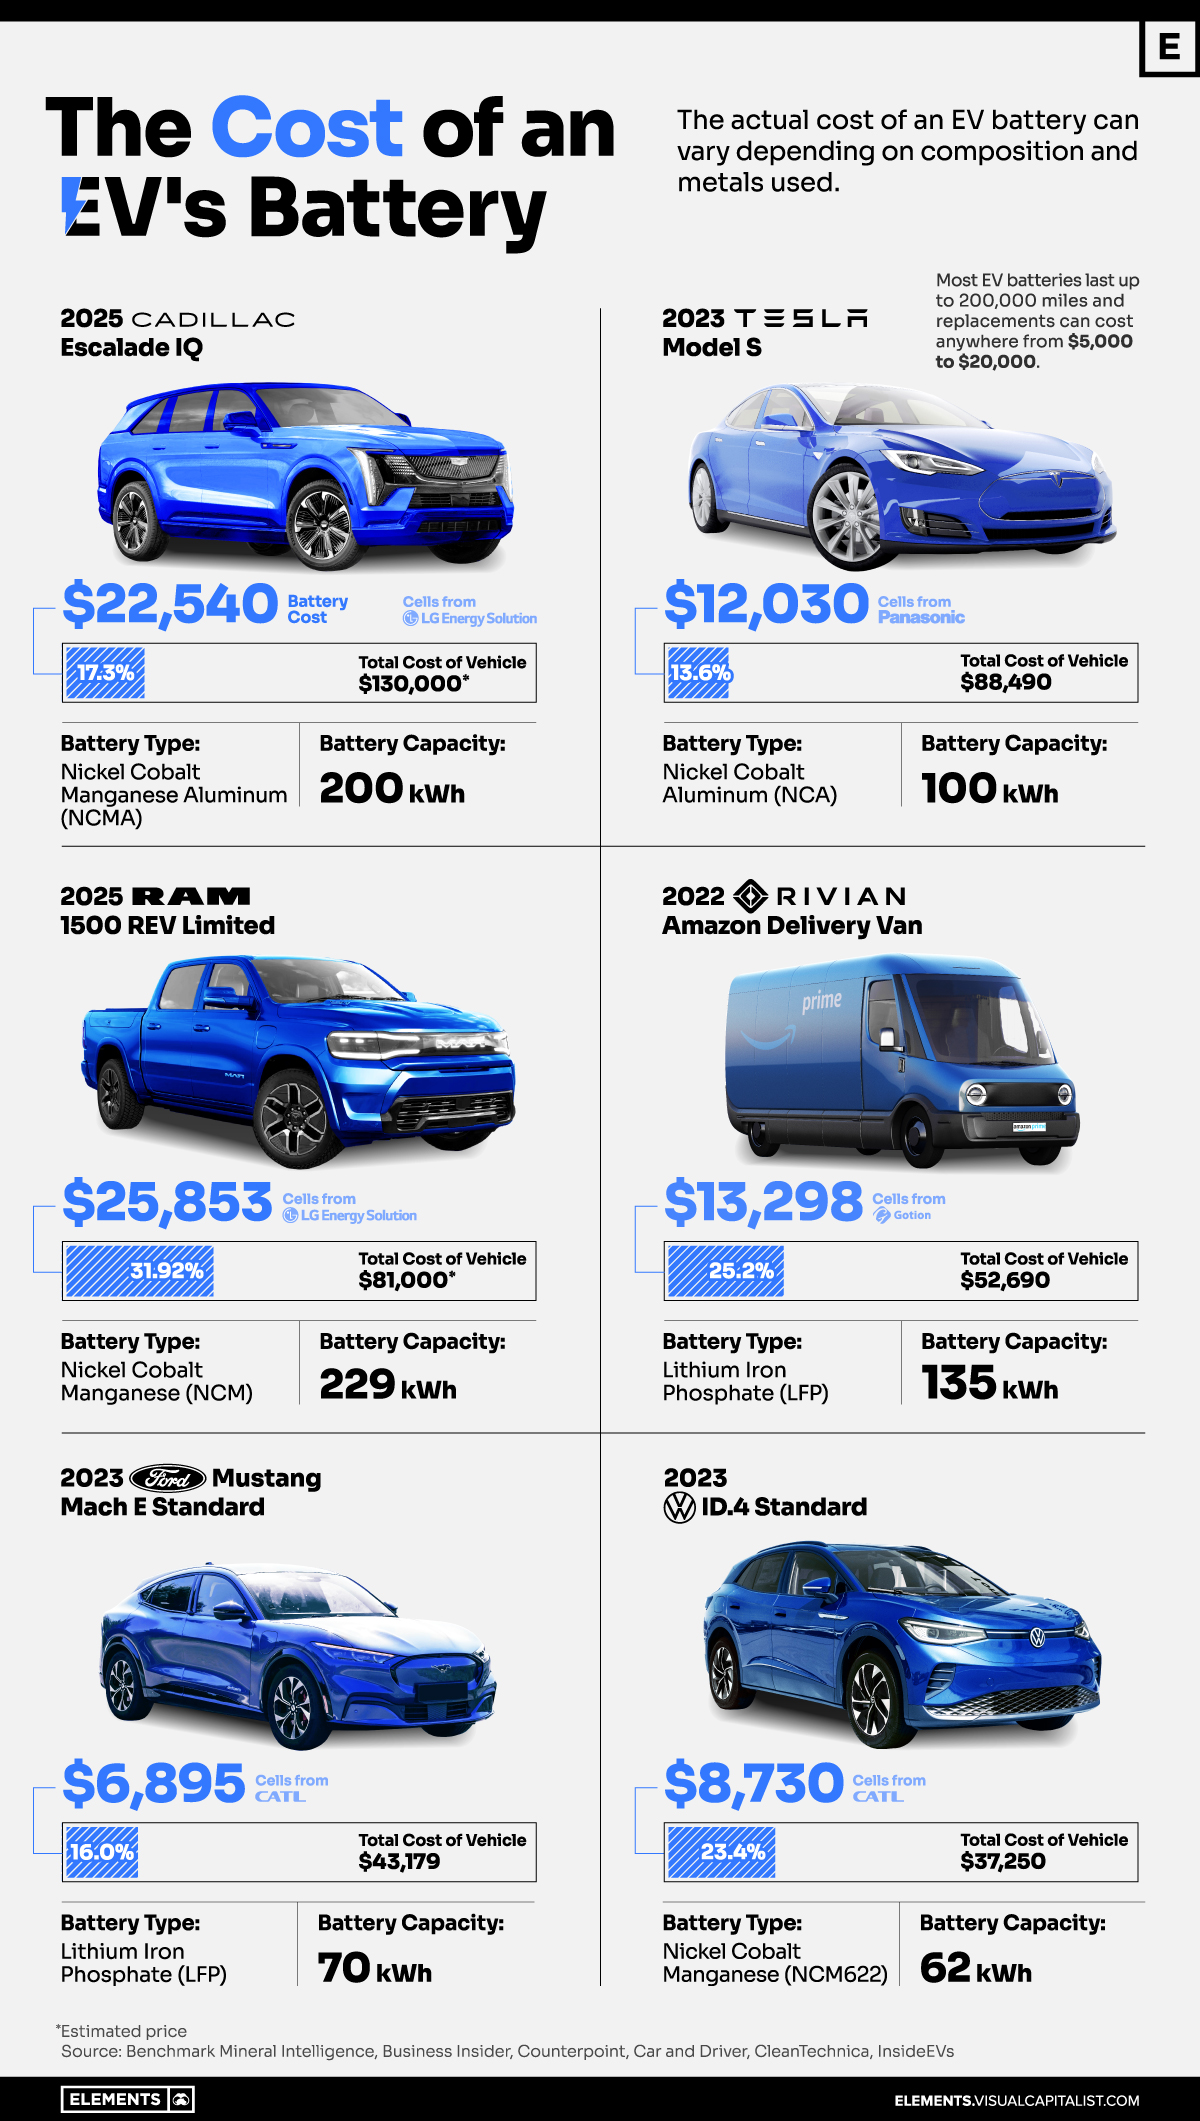
What is the Cost of Electric Vehicle Batteries?
The cost of an electric vehicle (EV) battery pack can vary depending on composition and chemistry.
In this graphic, we use data from Benchmark Minerals Intelligence to showcase the different costs of battery cells on popular electric vehicles.
Size Matters
Some EV owners are taken by surprise when they discover the cost of replacing their batteries.
Depending on the brand and model of the vehicle, the cost of a new lithium-ion battery pack might be as high as $25,000:
| Vehicle | Battery Type | Battery Capacity | Battery Cost | Total Cost of EV |
|---|---|---|---|---|
| 2025 Cadillac Escalade IQ | Nickel Cobalt Manganese Aluminum (NCMA) | 200 kWh | $22,540 | $130,000 |
| 2023 Tesla Model S | Nickel Cobalt Aluminum (NCA) | 100 kWh | $12,030 | $88,490 |
| 2025 RAM 1500 REV | Nickel Cobalt Manganese (NCM) | 229 kWh | $25,853 | $81,000 |
| 2022 Rivian Delivery Van | Lithium Iron phosphate (LFP) | 135 kWh | $13,298 | $52,690 |
| 2023 Ford Mustang | Lithium Iron Phosphate (LFP) | 70 kWh | $6,895 | $43,179 |
| 2023 VW ID.4 | Nickel Cobalt Manganese (NCM622) | 62 kWh | $8,730 | $37,250 |
The price of an EV battery pack can be shaped by various factors such as raw material costs, production expenses, packaging complexities, and supply chain stability. One of the main factors is chemical composition.
Graphite is the standard material used for the anodes in most lithium-ion batteries.
However, it is the mineral composition of the cathode that usually changes. It includes lithium and other minerals such as nickel, manganese, cobalt, or iron. This specific composition is pivotal in establishing the battery’s capacity, power, safety, lifespan, cost, and overall performance.
Lithium nickel cobalt aluminum oxide (NCA) battery cells have an average price of $120.3 per kilowatt-hour (kWh), while lithium nickel cobalt manganese oxide (NCM) has a slightly lower price point at $112.7 per kWh. Both contain significant nickel proportions, increasing the battery’s energy density and allowing for longer range.
At a lower cost are lithium iron phosphate (LFP) batteries, which are cheaper to make than cobalt and nickel-based variants. LFP battery cells have an average price of $98.5 per kWh. However, they offer less specific energy and are more suitable for standard- or short-range EVs.
Which Battery Dominates the EV Market?
In 2021, the battery market was dominated by NCM batteries, with 58% of the market share, followed by LFP and NCA, holding 21% each.
Looking ahead to 2026, the market share of LFP is predicted to nearly double, reaching 38%.
NCM is anticipated to constitute 45% of the market and NCA is expected to decline to 7%.


Electrification
Ranked: The Top 10 EV Battery Manufacturers in 2023
Asia dominates this ranking of the world’s largest EV battery manufacturers in 2023.

The Top 10 EV Battery Manufacturers in 2023
This was originally posted on our Voronoi app. Download the app for free on iOS or Android and discover incredible data-driven charts from a variety of trusted sources.
Despite efforts from the U.S. and EU to secure local domestic supply, all major EV battery manufacturers remain based in Asia.
In this graphic we rank the top 10 EV battery manufacturers by total battery deployment (measured in megawatt-hours) in 2023. The data is from EV Volumes.
Chinese Dominance
Contemporary Amperex Technology Co. Limited (CATL) has swiftly risen in less than a decade to claim the title of the largest global battery group.
The Chinese company now has a 34% share of the market and supplies batteries to a range of made-in-China vehicles, including the Tesla Model Y, SAIC’s MG4/Mulan, and Li Auto models.
| Company | Country | 2023 Production (megawatt-hour) | Share of Total Production |
|---|---|---|---|
| CATL | 🇨🇳China | 242,700 | 34% |
| BYD | 🇨🇳China | 115,917 | 16% |
| LG Energy Solution | 🇰🇷Korea | 108,487 | 15% |
| Panasonic | 🇯🇵Japan | 56,560 | 8% |
| SK On | 🇰🇷Korea | 40,711 | 6% |
| Samsung SDI | 🇰🇷Korea | 35,703 | 5% |
| CALB | 🇨🇳China | 23,493 | 3% |
| Farasis Energy | 🇨🇳China | 16,527 | 2% |
| Envision AESC | 🇨🇳China | 8,342 | 1% |
| Sunwoda | 🇨🇳China | 6,979 | 1% |
| Other | - | 56,040 | 8% |
In 2023, BYD surpassed LG Energy Solution to claim second place. This was driven by demand from its own models and growth in third-party deals, including providing batteries for the made-in-Germany Tesla Model Y, Toyota bZ3, Changan UNI-V, Venucia V-Online, as well as several Haval and FAW models.
The top three battery makers (CATL, BYD, LG) collectively account for two-thirds (66%) of total battery deployment.
Once a leader in the EV battery business, Panasonic now holds the fourth position with an 8% market share, down from 9% last year. With its main client, Tesla, now effectively sourcing batteries from multiple suppliers, the Japanese battery maker seems to be losing its competitive edge in the industry.
Overall, the global EV battery market size is projected to grow from $49 billion in 2022 to $98 billion by 2029, according to Fortune Business Insights.
Electrification
White Gold: Mapping U.S. Lithium Mines
In this graphic, Visual Capitalist partnerered with EnergyX to explore the size and location of U.S. lithium mines.

White Gold: Mapping U.S. Lithium Mines
The U.S. doubled imports of lithium-ion batteries for the third consecutive year in 2022, and with EV demand growing yearly, U.S. lithium mines must ramp up production or rely on other nations for their supply of refined lithium.
To determine if the domestic U.S. lithium opportunity can meet demand, we partnered with EnergyX to determine how much lithium sits within U.S. borders.
U.S. Lithium Projects
The most crucial measure of a lithium mine’s potential is the quantity that can be extracted from the source.
For each lithium resource, the potential volume of lithium carbonate equivalent (LCE) was calculated with a ratio of one metric ton of lithium producing 5.32 metric tons of LCE. Cumulatively, existing U.S. lithium projects contain 94.8 million metric tons of LCE.
| Rank | Project Name | LCE, million metric tons (est.) |
|---|---|---|
| 1 | McDermitt Caldera | 21.5 |
| 2 | Thacker Pass | 19.1 |
| 3 | Tonopah Flats | 18.0 |
| 4 | TLC Lithium | 10.7 |
| 5 | Clayton Valley (Century Lithium) | 6.3 |
| 6 | Zeus Lithium | 6.3 |
| 7 | Rhyolite Ridge | 3.4 |
| 8 | Arkansas Smackover (Phase 1A) | 2.8 |
| 9 | Basin Project | 2.2 |
| 10 | McGee Deposit | 2.1 |
| 11 | Arkansas Smackover (South West) | 1.8 |
| 12 | Clayton Valley (Lithium-X, Pure Energy) | 0.8 |
| 13 | Big Sandy | 0.3 |
| 14 | Imperial Valley/Salton Sea | 0.3 |
U.S. Lithium Opportunities, By State
U.S. lithium projects mainly exist in western states, with comparatively minor opportunities in central or eastern states.
| State | LCE, million metric tons (est.) |
|---|---|
| Nevada | 88.2 |
| Arkansas | 4.6 |
| Arizona | 2.5 |
| California | 0.3 |
Currently, the U.S. is sitting on a wealth of lithium that it is underutilizing. For context, in 2022, the U.S. only produced about 5,000 metric tons of LCE and imported a projected 19,000 metric tons of LCE, showing that the demand for the mineral is healthy.
The Next Gold Rush?
U.S. lithium companies have the opportunity to become global leaders in lithium production and accelerate the transition to sustainable energy sources. This is particularly important as the demand for lithium is increasing every year.
EnergyX is on a mission to meet U.S. lithium demands using groundbreaking technology that can extract 300% more lithium from a source than traditional methods.
You can take advantage of this opportunity by investing in EnergyX and joining other significant players like GM in becoming a shareholder.


-

 Electrification3 years ago
Ranked: The Top 10 EV Battery Manufacturers
-

 Electrification2 years ago
The Key Minerals in an EV Battery
-

 Real Assets3 years ago
The World’s Top 10 Gold Mining Companies
-

 Misc3 years ago
All the Metals We Mined in One Visualization
-

 Electrification3 years ago
The Biggest Mining Companies in the World in 2021
-

 Energy Shift2 years ago
What Are the Five Major Types of Renewable Energy?
-

 Electrification2 years ago
Mapped: Solar Power by Country in 2021
-

 Electrification2 years ago
The World’s Largest Nickel Mining Companies