

Electrification
Visualizing the Demand for Battery Raw Materials
The following content is sponsored by Wood Mackenzie
Visualizing the Demand for Battery Raw Materials
Metals play a pivotal role in the energy transition, as EVs and energy storage systems rely on batteries, which, in turn, require metals.
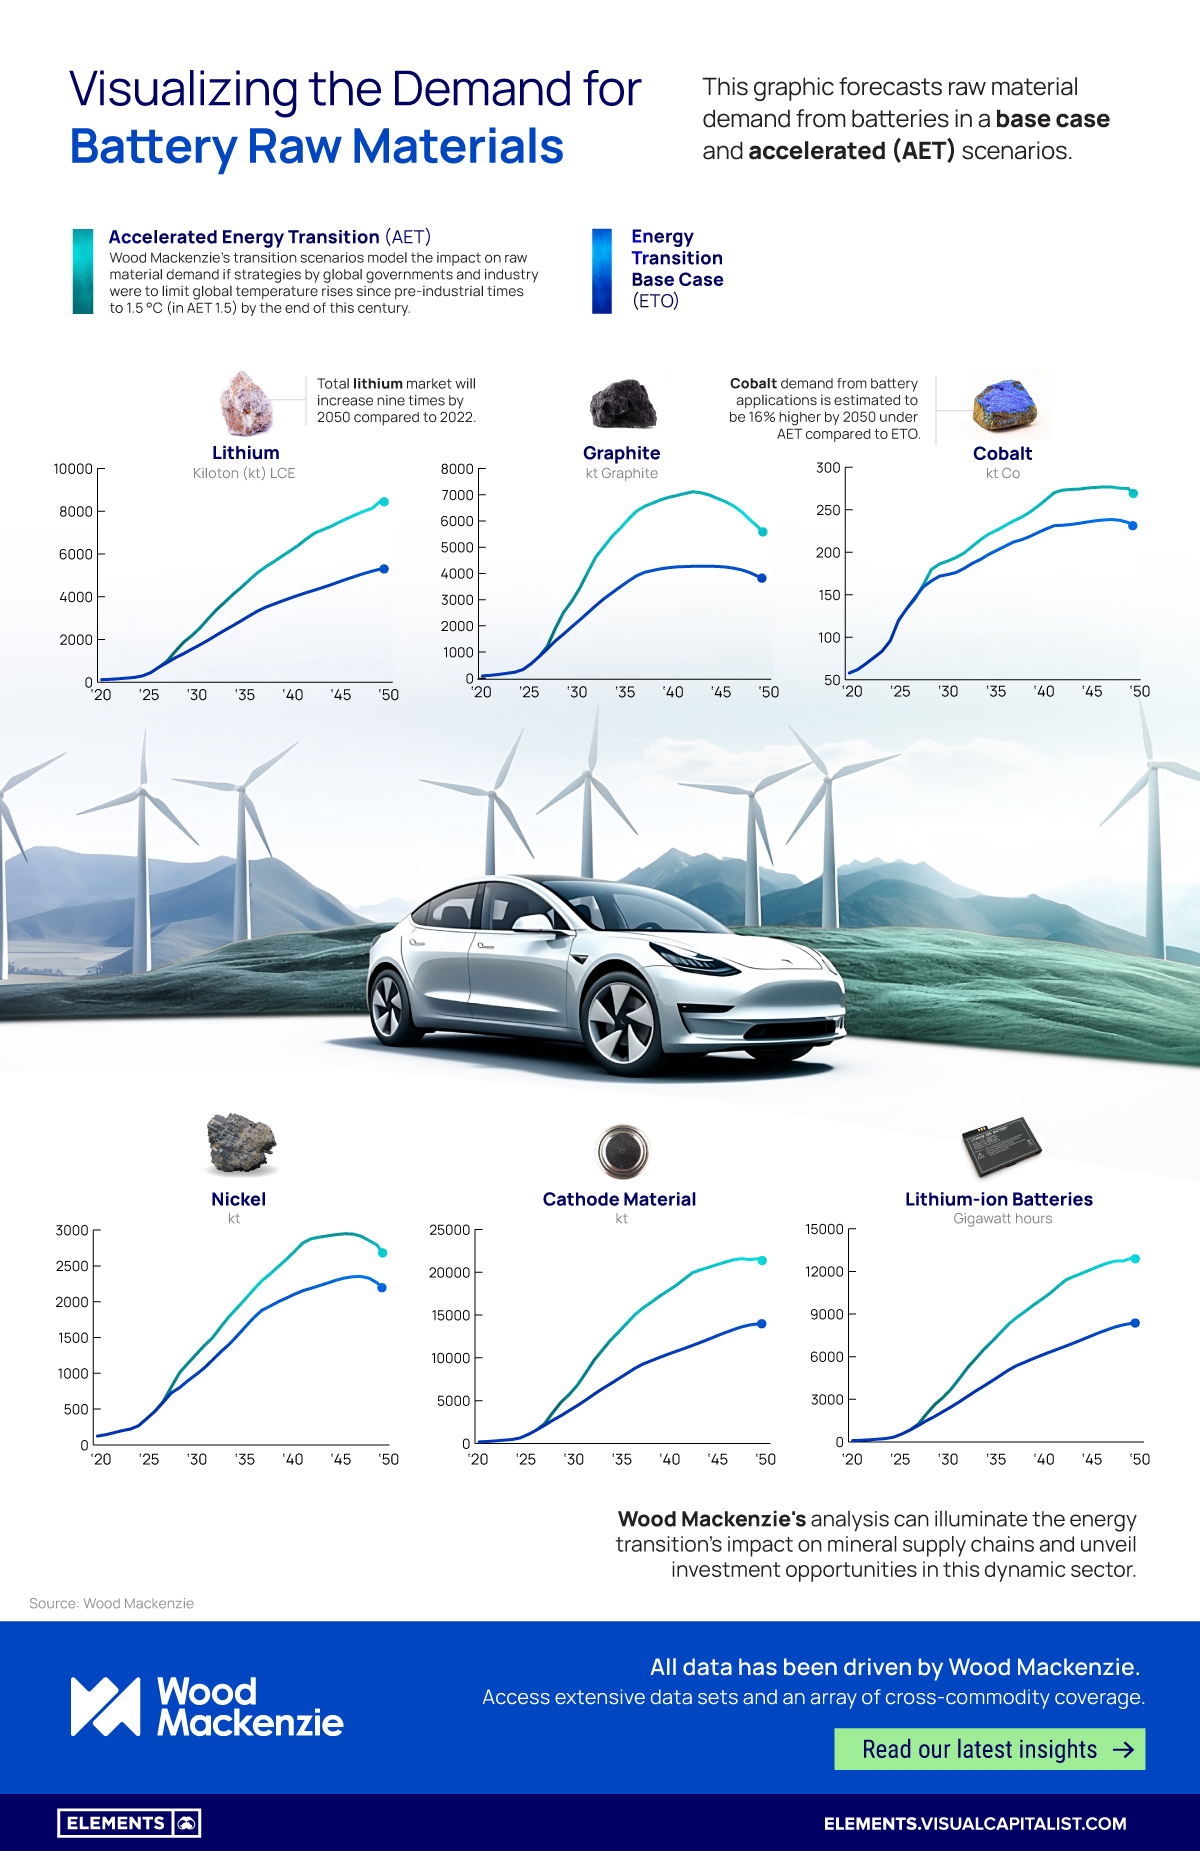
This graphic, sponsored by Wood Mackenzie, forecasts raw material demand from batteries. It presents a base case scenario that incorporates the evolution of current policies, indicating a global temperature rise of 2.5°C by 2100. Additionally, it explores an accelerated (AET) scenario, where the world aims to limit the rise in global temperatures to 1.5°C by the end of this century.
Growing Demand for Metals in an Accelerated Scenario
Lithium is a crucial material in high-energy-density rechargeable lithium-ion batteries.
The lithium fueling electric vehicle batteries undergoes refinement from compounds sourced in salt-brine pools or hard rock and quantities are measured in terms of lithium carbonate equivalent (LCE).
According to Wood Mackenzie, by 2030, the demand for LCE is expected to be 55% higher in an AET scenario compared to the base case, and 59% higher by 2050.
| Base Case | Unit | 2023 | 2030 | 2050 |
| Battery demand (Li-ion and Na-ion) | GWh | 1,152 | 3,577 | 8,395 |
| Cathode active material (Li-ion and Na-ion) | kt | 2,132 | 6,376 | 13,995 |
| Lithium | kt LCE | 878 | 2,390 | 5,275 |
| Nickel | kt | 596 | 1,299 | 2,151 |
| Cobalt | kt | 147 | 187 | 228 |
| Manganese | kt | 207 | 687 | 1,491 |
| Graphite | kt | 1,119 | 3,034 | 3,748 |
| AET | Unit | 2023 | 2030 | 2050 |
| Battery demand (Li-ion and Na-ion) | GWh | 1,250 | 5,856 | 12,819 |
| Cathode active material (Li-ion and Na-ion) | kt | 2,326 | 10,865 | 21,149 |
| Lithium | kt LCE | 954 | 3,701 | 8,384 |
| Nickel | kt | 606 | 1,648 | 2,629 |
| Cobalt | kt | 145 | 207 | 265 |
| Manganese | kt | 225 | 1,124 | 2,163 |
| Graphite | kt | 1,220 | 5,018 | 5,461 |
The demand for two other essential metals in battery production, cobalt and nickel, is expected to be 16% and 22% higher, respectively, in 2050 in the AET scenario compared to the base case.
Given that graphite is the primary anode material for an EV battery, it also represents the largest component by weight in the average EV. The demand for graphite in an AET scenario is anticipated to be 46% higher than in a base case scenario.
Battery Materials Supply Chain
According to Wood Mackenzie data, an accelerated energy transition would require much more capital within a short timeframe for developing the battery raw materials supply chain – from mines through to refineries and cell production facilities.
Increased participation from Original Equipment Manufacturers (OEMs) will be necessary, risking EV sales penetration rates remaining below 15% in the medium term, in contrast to approximately 40% in the total market under an AET scenario.
In addition, finding alternative sources of metals, including using secondary supply through recycling, is another option available to the industry.
However, as noted in Wood Mackenzie’s research, current EV sales are too low to generate a sufficiently large scrap pool to create any meaningful new source of supply by 2030.
Access insights on the entire battery industry supply chain with Electric Vehicle & Battery Supply Chain Service by Wood Mackenzie.


Electrification
Ranked: The Top 10 EV Battery Manufacturers in 2023
Asia dominates this ranking of the world’s largest EV battery manufacturers in 2023.

The Top 10 EV Battery Manufacturers in 2023
This was originally posted on our Voronoi app. Download the app for free on iOS or Android and discover incredible data-driven charts from a variety of trusted sources.
Despite efforts from the U.S. and EU to secure local domestic supply, all major EV battery manufacturers remain based in Asia.
In this graphic we rank the top 10 EV battery manufacturers by total battery deployment (measured in megawatt-hours) in 2023. The data is from EV Volumes.
Chinese Dominance
Contemporary Amperex Technology Co. Limited (CATL) has swiftly risen in less than a decade to claim the title of the largest global battery group.
The Chinese company now has a 34% share of the market and supplies batteries to a range of made-in-China vehicles, including the Tesla Model Y, SAIC’s MG4/Mulan, and Li Auto models.
| Company | Country | 2023 Production (megawatt-hour) | Share of Total Production |
|---|---|---|---|
| CATL | 🇨🇳China | 242,700 | 34% |
| BYD | 🇨🇳China | 115,917 | 16% |
| LG Energy Solution | 🇰🇷Korea | 108,487 | 15% |
| Panasonic | 🇯🇵Japan | 56,560 | 8% |
| SK On | 🇰🇷Korea | 40,711 | 6% |
| Samsung SDI | 🇰🇷Korea | 35,703 | 5% |
| CALB | 🇨🇳China | 23,493 | 3% |
| Farasis Energy | 🇨🇳China | 16,527 | 2% |
| Envision AESC | 🇨🇳China | 8,342 | 1% |
| Sunwoda | 🇨🇳China | 6,979 | 1% |
| Other | - | 56,040 | 8% |
In 2023, BYD surpassed LG Energy Solution to claim second place. This was driven by demand from its own models and growth in third-party deals, including providing batteries for the made-in-Germany Tesla Model Y, Toyota bZ3, Changan UNI-V, Venucia V-Online, as well as several Haval and FAW models.
The top three battery makers (CATL, BYD, LG) collectively account for two-thirds (66%) of total battery deployment.
Once a leader in the EV battery business, Panasonic now holds the fourth position with an 8% market share, down from 9% last year. With its main client, Tesla, now effectively sourcing batteries from multiple suppliers, the Japanese battery maker seems to be losing its competitive edge in the industry.
Overall, the global EV battery market size is projected to grow from $49 billion in 2022 to $98 billion by 2029, according to Fortune Business Insights.
Electrification
White Gold: Mapping U.S. Lithium Mines
In this graphic, Visual Capitalist partnerered with EnergyX to explore the size and location of U.S. lithium mines.

White Gold: Mapping U.S. Lithium Mines
The U.S. doubled imports of lithium-ion batteries for the third consecutive year in 2022, and with EV demand growing yearly, U.S. lithium mines must ramp up production or rely on other nations for their supply of refined lithium.
To determine if the domestic U.S. lithium opportunity can meet demand, we partnered with EnergyX to determine how much lithium sits within U.S. borders.
U.S. Lithium Projects
The most crucial measure of a lithium mine’s potential is the quantity that can be extracted from the source.
For each lithium resource, the potential volume of lithium carbonate equivalent (LCE) was calculated with a ratio of one metric ton of lithium producing 5.32 metric tons of LCE. Cumulatively, existing U.S. lithium projects contain 94.8 million metric tons of LCE.
| Rank | Project Name | LCE, million metric tons (est.) |
|---|---|---|
| 1 | McDermitt Caldera | 21.5 |
| 2 | Thacker Pass | 19.1 |
| 3 | Tonopah Flats | 18.0 |
| 4 | TLC Lithium | 10.7 |
| 5 | Clayton Valley (Century Lithium) | 6.3 |
| 6 | Zeus Lithium | 6.3 |
| 7 | Rhyolite Ridge | 3.4 |
| 8 | Arkansas Smackover (Phase 1A) | 2.8 |
| 9 | Basin Project | 2.2 |
| 10 | McGee Deposit | 2.1 |
| 11 | Arkansas Smackover (South West) | 1.8 |
| 12 | Clayton Valley (Lithium-X, Pure Energy) | 0.8 |
| 13 | Big Sandy | 0.3 |
| 14 | Imperial Valley/Salton Sea | 0.3 |
U.S. Lithium Opportunities, By State
U.S. lithium projects mainly exist in western states, with comparatively minor opportunities in central or eastern states.
| State | LCE, million metric tons (est.) |
|---|---|
| Nevada | 88.2 |
| Arkansas | 4.6 |
| Arizona | 2.5 |
| California | 0.3 |
Currently, the U.S. is sitting on a wealth of lithium that it is underutilizing. For context, in 2022, the U.S. only produced about 5,000 metric tons of LCE and imported a projected 19,000 metric tons of LCE, showing that the demand for the mineral is healthy.
The Next Gold Rush?
U.S. lithium companies have the opportunity to become global leaders in lithium production and accelerate the transition to sustainable energy sources. This is particularly important as the demand for lithium is increasing every year.
EnergyX is on a mission to meet U.S. lithium demands using groundbreaking technology that can extract 300% more lithium from a source than traditional methods.
You can take advantage of this opportunity by investing in EnergyX and joining other significant players like GM in becoming a shareholder.


-

 Electrification3 years ago
Ranked: The Top 10 EV Battery Manufacturers
-

 Electrification2 years ago
The Key Minerals in an EV Battery
-

 Real Assets3 years ago
The World’s Top 10 Gold Mining Companies
-

 Misc3 years ago
All the Metals We Mined in One Visualization
-

 Electrification3 years ago
The Biggest Mining Companies in the World in 2021
-

 Energy Shift2 years ago
What Are the Five Major Types of Renewable Energy?
-

 Electrification2 years ago
Mapped: Solar Power by Country in 2021
-

 Electrification2 years ago
The World’s Largest Nickel Mining Companies