

Electrification
Ranked: The Top 10 EV Battery Manufacturers
Ranked: The Top 10 EV Battery Manufacturers
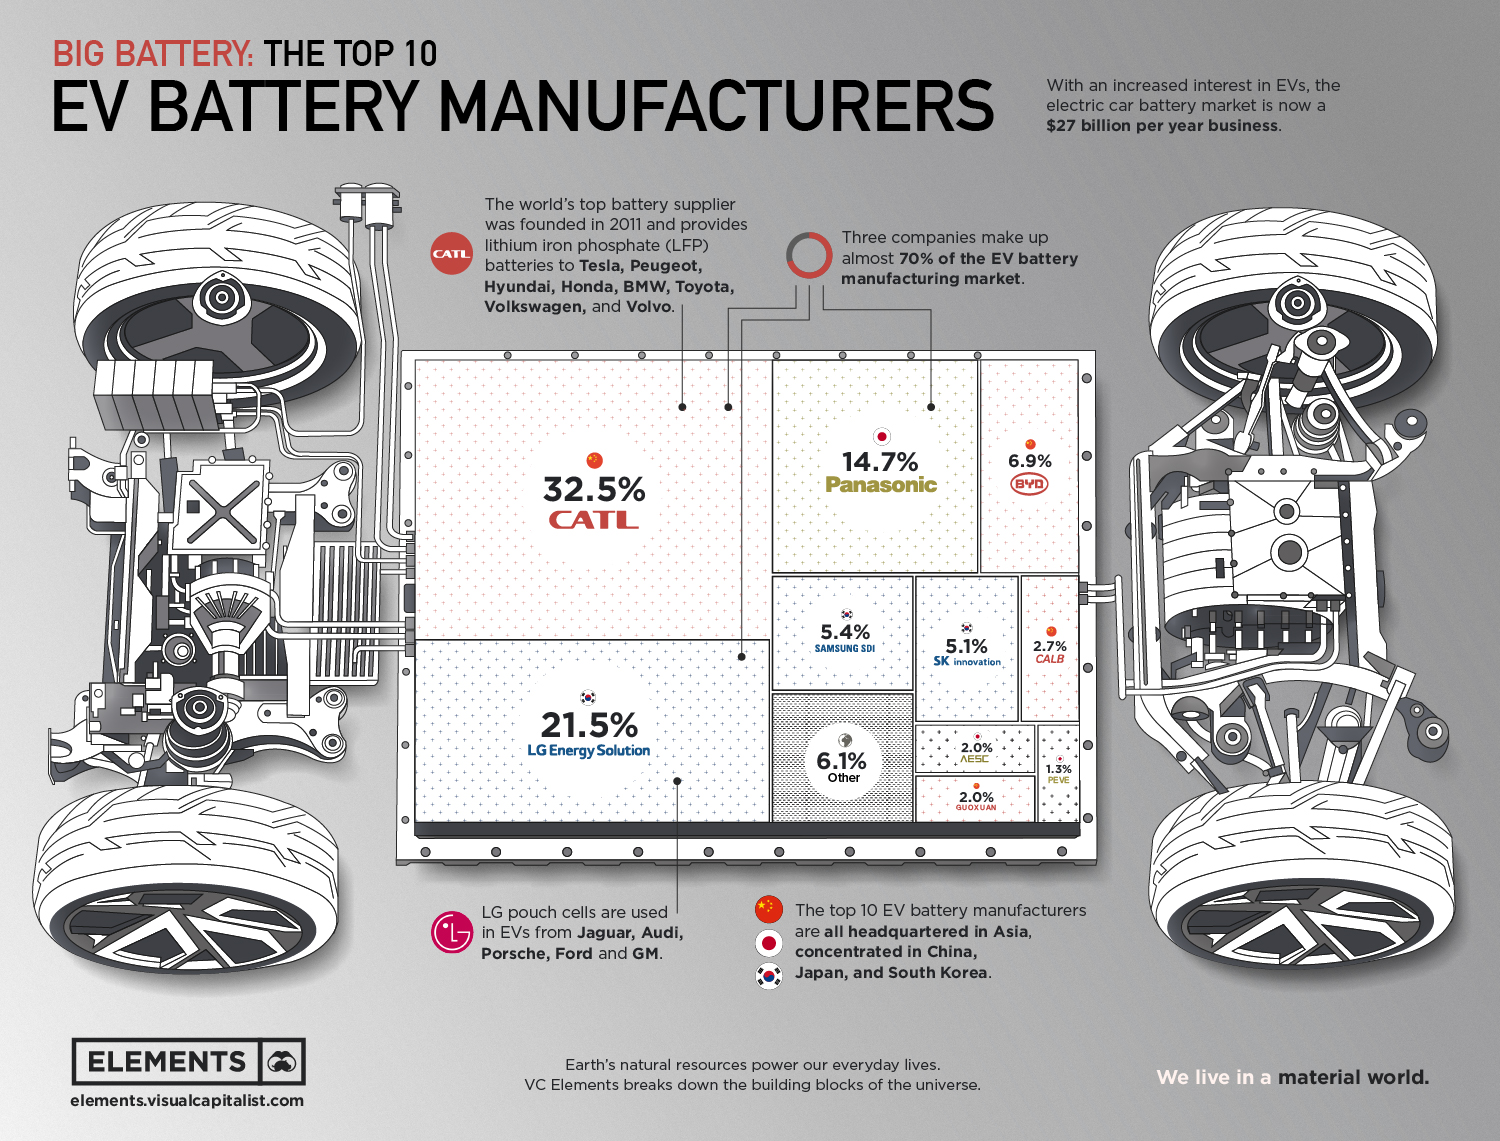
With increasing interest in electric vehicles (EVs) from consumers, the market for lithium-ion EV batteries is now a $27 billion per year business.
According to industry experts, high demand has boosted battery manufacturers’ profits and brought heavy competition to the market. And by 2027, the market could further grow to $127 billion as consumers embrace more affordable EVs.
Asian Powerhouses of Battery Production
Besides being a manufacturing powerhouse of vehicle parts, Asia is fast becoming a hotbed for innovation in the battery sector.
No wonder, the top 10 EV battery manufacturers by market share are all headquartered in Asian countries, concentrated in China, Japan, and South Korea.
| Rank | Company | 2021 Market Share | Country |
|---|---|---|---|
| #1 | CATL | 32.5% | China 🇨🇳 |
| #2 | LG Energy Solution | 21.5% | Korea 🇰🇷 |
| #3 | Panasonic | 14.7% | Japan 🇯🇵 |
| #4 | BYD | 6.9% | China 🇨🇳 |
| #5 | Samsung SDI | 5.4% | Korea 🇰🇷 |
| #6 | SK Innovation | 5.1% | Korea 🇰🇷 |
| #7 | CALB | 2.7% | China 🇨🇳 |
| #8 | AESC | 2.0% | Japan 🇯🇵 |
| #9 | Guoxuan | 2.0% | China 🇨🇳 |
| #10 | PEVE | 1.3% | Japan 🇯🇵 |
| n/a | Other | 6.1% | ROW |
According to data from SNE Research, the top three battery makers—CATL, LG, and, Panasonic—combine for nearly 70% of the EV battery manufacturing market.
Chinese Dominance
Based in China’s coastal city of Ningde, best known for its tea plantations, Contemporary Amperex Technology Co. Limited (CATL) has risen in less than 10 years to become the biggest global battery group.
The Chinese company provides lithium iron phosphate (LFP) batteries to Tesla, Peugeot, Hyundai, Honda, BMW, Toyota, Volkswagen, and Volvo, and shares in the company gained 160% in 2020, lifting CATL’s market capitalization to almost $186 billion.
CATL counts nine people on the Forbes list of global billionaires. Its founder, Zeng Yuqun, born in a poor village in 1968 during the Chinese Cultural Revolution, is now worth almost as much as Alibaba founder Jack Ma.
China also hosts the fourth biggest battery manufacturer, Warren Buffett-backed BYD.
Competition for CATL Outside China
Outside China, CATL faces tough competition from established players LG and Panasonic, respectively second and third on our ranking.
With more than 100 years of history, Panasonic has Tesla and Toyota among its battery buyers. LG pouch cells are used in EVs from Jaguar, Audi, Porsche, Ford, and GM.
U.S. and Europe’s Plans for Battery Production
President Joe Biden’s strategy to make the United States a powerhouse in electric vehicles includes boosting domestic production of batteries. European countries are also looking to reduce decades of growing reliance on China.
As Western countries speed up, new players are expected to rise.
A host of next-generation battery technologies are already being developed by U.S. companies, including Ionic Materials, QuantumScape, Sila Nanotechnologies, Sion Power, and, Sionic Energy.
Any direction the market moves, certainly the forecast is bright for battery producers.


Electrification
Ranked: The Top 10 EV Battery Manufacturers in 2023
Asia dominates this ranking of the world’s largest EV battery manufacturers in 2023.

The Top 10 EV Battery Manufacturers in 2023
This was originally posted on our Voronoi app. Download the app for free on iOS or Android and discover incredible data-driven charts from a variety of trusted sources.
Despite efforts from the U.S. and EU to secure local domestic supply, all major EV battery manufacturers remain based in Asia.
In this graphic we rank the top 10 EV battery manufacturers by total battery deployment (measured in megawatt-hours) in 2023. The data is from EV Volumes.
Chinese Dominance
Contemporary Amperex Technology Co. Limited (CATL) has swiftly risen in less than a decade to claim the title of the largest global battery group.
The Chinese company now has a 34% share of the market and supplies batteries to a range of made-in-China vehicles, including the Tesla Model Y, SAIC’s MG4/Mulan, and Li Auto models.
| Company | Country | 2023 Production (megawatt-hour) | Share of Total Production |
|---|---|---|---|
| CATL | 🇨🇳China | 242,700 | 34% |
| BYD | 🇨🇳China | 115,917 | 16% |
| LG Energy Solution | 🇰🇷Korea | 108,487 | 15% |
| Panasonic | 🇯🇵Japan | 56,560 | 8% |
| SK On | 🇰🇷Korea | 40,711 | 6% |
| Samsung SDI | 🇰🇷Korea | 35,703 | 5% |
| CALB | 🇨🇳China | 23,493 | 3% |
| Farasis Energy | 🇨🇳China | 16,527 | 2% |
| Envision AESC | 🇨🇳China | 8,342 | 1% |
| Sunwoda | 🇨🇳China | 6,979 | 1% |
| Other | - | 56,040 | 8% |
In 2023, BYD surpassed LG Energy Solution to claim second place. This was driven by demand from its own models and growth in third-party deals, including providing batteries for the made-in-Germany Tesla Model Y, Toyota bZ3, Changan UNI-V, Venucia V-Online, as well as several Haval and FAW models.
The top three battery makers (CATL, BYD, LG) collectively account for two-thirds (66%) of total battery deployment.
Once a leader in the EV battery business, Panasonic now holds the fourth position with an 8% market share, down from 9% last year. With its main client, Tesla, now effectively sourcing batteries from multiple suppliers, the Japanese battery maker seems to be losing its competitive edge in the industry.
Overall, the global EV battery market size is projected to grow from $49 billion in 2022 to $98 billion by 2029, according to Fortune Business Insights.
Electrification
White Gold: Mapping U.S. Lithium Mines
In this graphic, Visual Capitalist partnerered with EnergyX to explore the size and location of U.S. lithium mines.

White Gold: Mapping U.S. Lithium Mines
The U.S. doubled imports of lithium-ion batteries for the third consecutive year in 2022, and with EV demand growing yearly, U.S. lithium mines must ramp up production or rely on other nations for their supply of refined lithium.
To determine if the domestic U.S. lithium opportunity can meet demand, we partnered with EnergyX to determine how much lithium sits within U.S. borders.
U.S. Lithium Projects
The most crucial measure of a lithium mine’s potential is the quantity that can be extracted from the source.
For each lithium resource, the potential volume of lithium carbonate equivalent (LCE) was calculated with a ratio of one metric ton of lithium producing 5.32 metric tons of LCE. Cumulatively, existing U.S. lithium projects contain 94.8 million metric tons of LCE.
| Rank | Project Name | LCE, million metric tons (est.) |
|---|---|---|
| 1 | McDermitt Caldera | 21.5 |
| 2 | Thacker Pass | 19.1 |
| 3 | Tonopah Flats | 18.0 |
| 4 | TLC Lithium | 10.7 |
| 5 | Clayton Valley (Century Lithium) | 6.3 |
| 6 | Zeus Lithium | 6.3 |
| 7 | Rhyolite Ridge | 3.4 |
| 8 | Arkansas Smackover (Phase 1A) | 2.8 |
| 9 | Basin Project | 2.2 |
| 10 | McGee Deposit | 2.1 |
| 11 | Arkansas Smackover (South West) | 1.8 |
| 12 | Clayton Valley (Lithium-X, Pure Energy) | 0.8 |
| 13 | Big Sandy | 0.3 |
| 14 | Imperial Valley/Salton Sea | 0.3 |
U.S. Lithium Opportunities, By State
U.S. lithium projects mainly exist in western states, with comparatively minor opportunities in central or eastern states.
| State | LCE, million metric tons (est.) |
|---|---|
| Nevada | 88.2 |
| Arkansas | 4.6 |
| Arizona | 2.5 |
| California | 0.3 |
Currently, the U.S. is sitting on a wealth of lithium that it is underutilizing. For context, in 2022, the U.S. only produced about 5,000 metric tons of LCE and imported a projected 19,000 metric tons of LCE, showing that the demand for the mineral is healthy.
The Next Gold Rush?
U.S. lithium companies have the opportunity to become global leaders in lithium production and accelerate the transition to sustainable energy sources. This is particularly important as the demand for lithium is increasing every year.
EnergyX is on a mission to meet U.S. lithium demands using groundbreaking technology that can extract 300% more lithium from a source than traditional methods.
You can take advantage of this opportunity by investing in EnergyX and joining other significant players like GM in becoming a shareholder.


-

 Electrification2 years ago
The Key Minerals in an EV Battery
-

 Real Assets3 years ago
The World’s Top 10 Gold Mining Companies
-

 Misc3 years ago
All the Metals We Mined in One Visualization
-

 Electrification3 years ago
The Biggest Mining Companies in the World in 2021
-

 Energy Shift2 years ago
What Are the Five Major Types of Renewable Energy?
-

 Electrification2 years ago
Mapped: Solar Power by Country in 2021
-

 Electrification2 years ago
The World’s Largest Nickel Mining Companies
-

 Electrification3 years ago
How Much Land is Needed to Power the U.S. with Solar?