

Energy Shift
Ranked: The World’s Biggest Oil Producers
Ranked: The World’s Biggest Oil Producers
This visualization originally appeared on Visual Capitalist
In 2022 oil prices peaked at more than $100 per barrel, hitting an eight-year high, after a full year of turmoil in the energy markets in the wake of the Russian invasion of Ukraine.
Oil companies doubled their profits and the economies of the biggest oil producers in the world got a major boost.
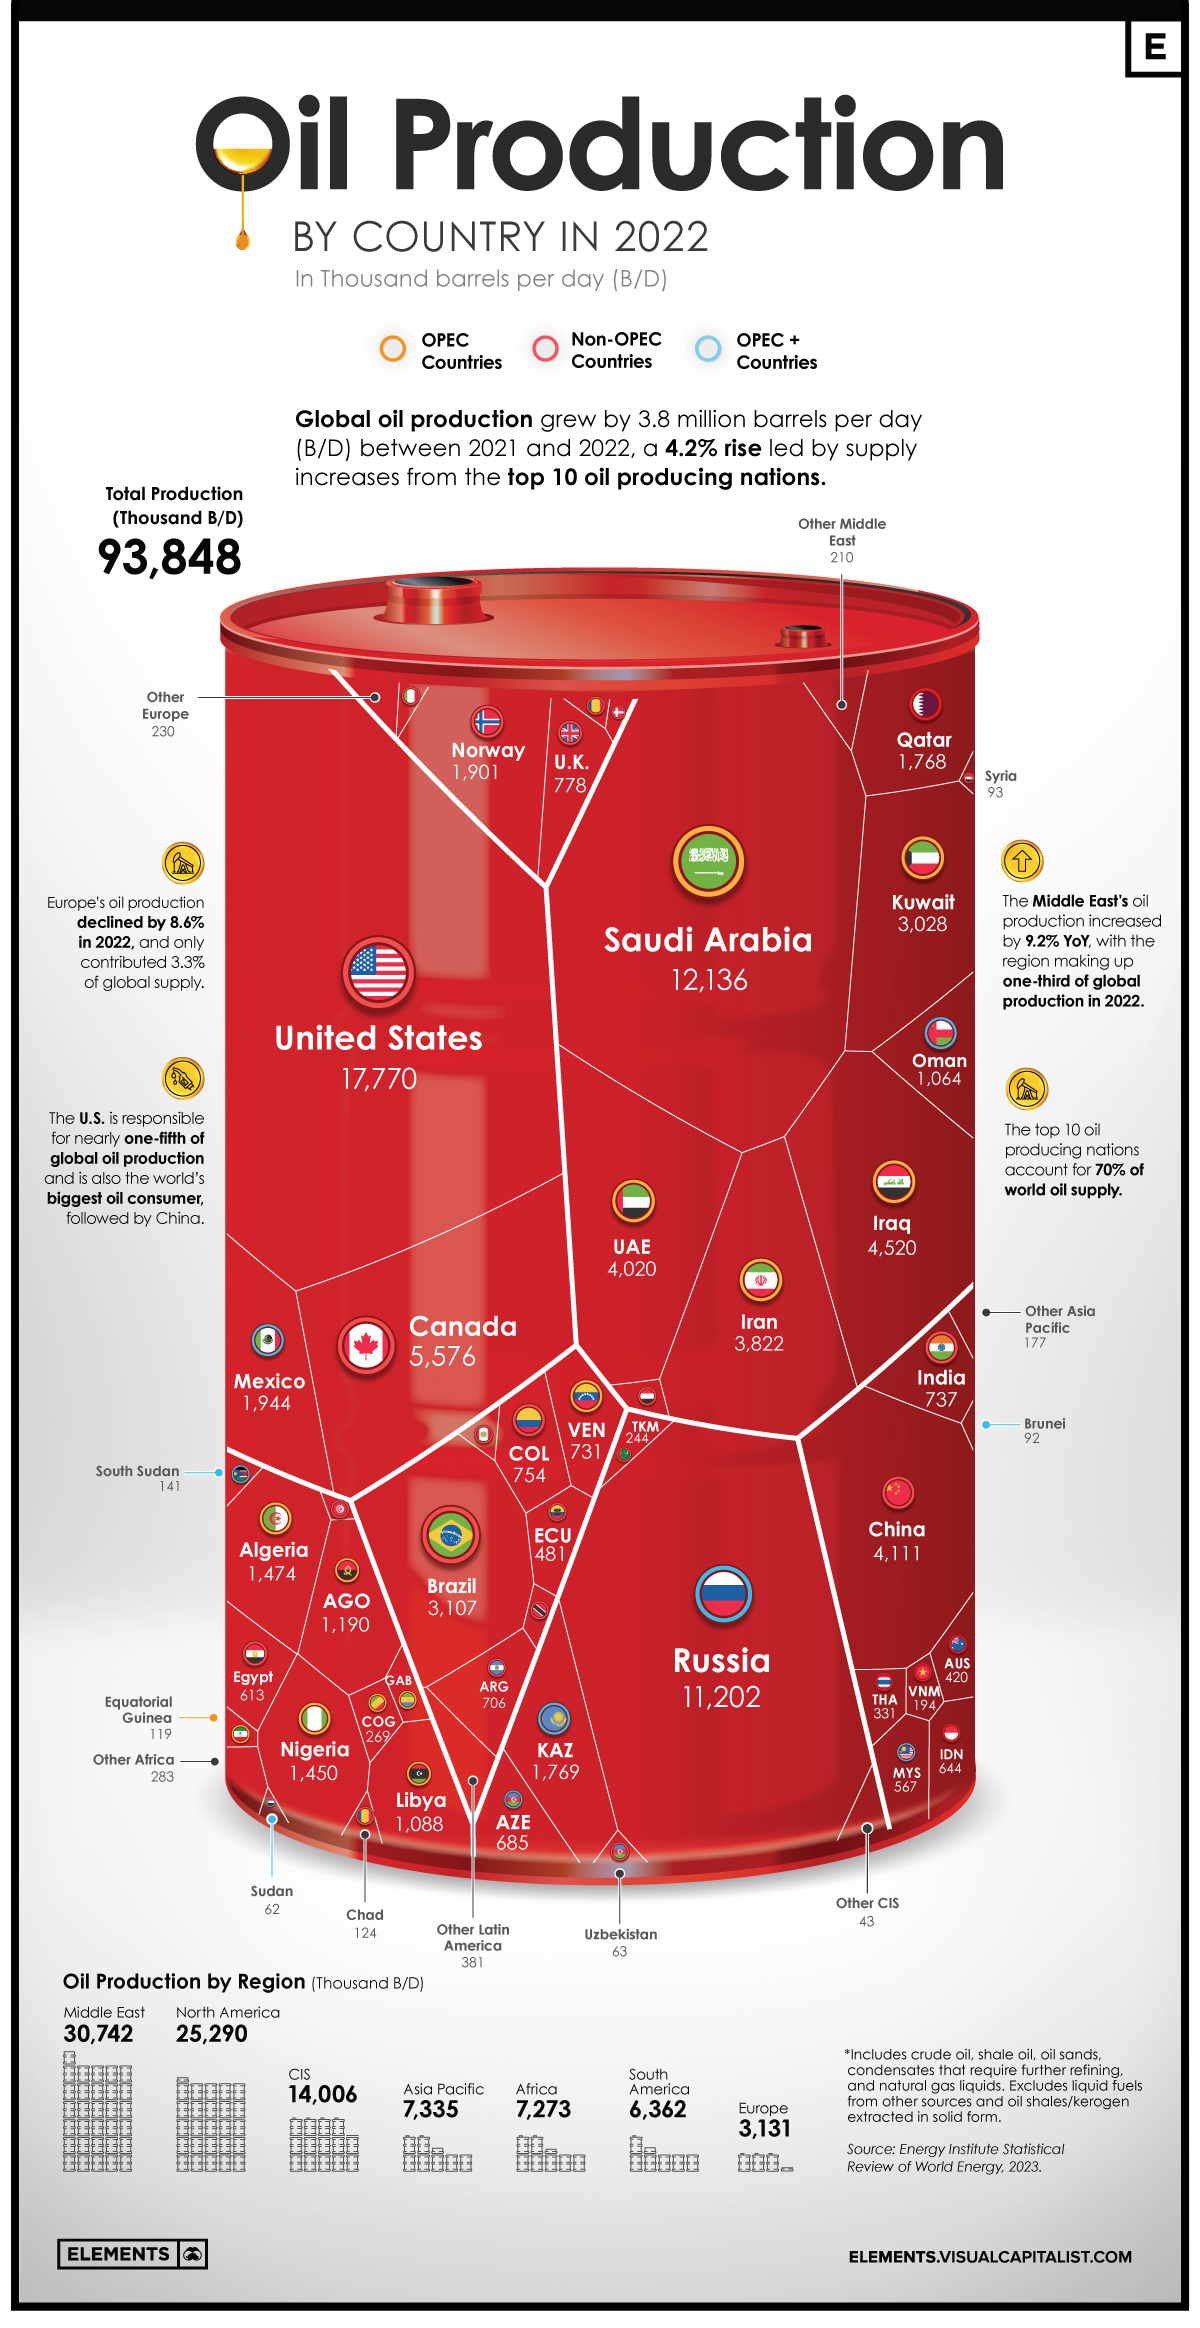
But which countries are responsible for most of the world’s oil supply? Using data from the Statistical Review of World Energy by the Energy Institute, we’ve visualized and ranked the world’s biggest oil producers.
Ranked: Oil Production By Country, in 2022
The U.S. has been the world’s biggest oil producer since 2018 and continued its dominance in 2022 by producing close to 18 million barrels per day (B/D). This accounted for nearly one-fifth of the world’s oil supply.
Almost three-fourths of the country’s oil production is centered around five states: Texas, New Mexico, North Dakota, Alaska, and Colorado.
We rank the other major oil producers in the world below.
| Rank | Country | 2022 Production (Thousand B/D) | YoY Change | Share of World Supply |
|---|---|---|---|---|
| 1 | 🇺🇸 U.S. | 17,770 | +6.5% | 18.9% |
| 2 | 🇸🇦 Saudi Arabia | 12,136 | +10.8% | 12.9% |
| 3 | 🇷🇺 Russia | 11,202 | +1.8% | 11.9% |
| 4 | 🇨🇦 Canada | 5,576 | +3.0% | 5.9% |
| 5 | 🇮🇶 Iraq | 4,520 | +10.2% | 4.8% |
| 6 | 🇨🇳 China | 4,111 | +2.9% | 4.4% |
| 7 | 🇦🇪 UAE | 4,020 | +10.4% | 4.3% |
| 8 | 🇮🇷 Iran | 3,822 | +4.6% | 4.1% |
| 9 | 🇧🇷 Brazil | 3,107 | +3.9% | 3.3% |
| 10 | 🇰🇼 Kuwait | 3,028 | +12.0% | 3.2% |
| 11 | 🇲🇽 Mexico | 1,944 | +0.9% | 2.1% |
| 12 | 🇳🇴 Norway | 1,901 | -6.3% | 2.0% |
| 13 | 🇰🇿 Kazakhstan | 1,769 | -2.0% | 1.9% |
| 14 | 🇶🇦 Qatar | 1,768 | +1.8% | 1.9% |
| 15 | 🇩🇿 Algeria | 1,474 | +8.9% | 1.6% |
| 16 | 🇳🇬 Nigeria | 1,450 | -11.2% | 1.5% |
| 17 | 🇦🇴 Angola | 1,190 | +1.1% | 1.3% |
| 18 | 🇱🇾 Libya | 1,088 | -14.3% | 1.2% |
| 19 | 🇴🇲 Oman | 1,064 | +9.6% | 1.1% |
| 20 | 🇬🇧 UK | 778 | -11.0% | 0.8% |
| 21 | 🇨🇴 Colombia | 754 | +2.4% | 0.8% |
| 22 | 🇮🇳 India | 737 | -3.8% | 0.8% |
| 23 | 🇻🇪 Venezuela | 731 | +8.1% | 0.8% |
| 24 | 🇦🇷 Argentina | 706 | +12.4% | 0.8% |
| 25 | 🇦🇿 Azerbaijan | 685 | -5.6% | 0.7% |
| 26 | 🇮🇩 Indonesia | 644 | -6.9% | 0.7% |
| 27 | 🇪🇬 Egypt | 613 | +0.8% | 0.7% |
| 28 | 🇲🇾 Malaysia | 567 | -1.7% | 0.6% |
| 29 | 🇪🇨 Ecuador | 481 | +1.7% | 0.5% |
| 30 | 🇦🇺 Australia | 420 | -5.2% | 0.4% |
| 31 | 🇹🇭 Thailand | 331 | -17.5% | 0.4% |
| 32 | 🇨🇩 Congo | 269 | -1.7% | 0.3% |
| 33 | 🇹🇲 Turkmenistan | 244 | +1.0% | 0.3% |
| 34 | 🇻🇳 Vietnam | 194 | -1.2% | 0.2% |
| 35 | 🇬🇦 Gabon | 191 | +5.4% | 0.2% |
| 36 | 🇸🇸 South Sudan | 141 | -7.6% | 0.2% |
| 37 | 🇵🇪 Peru | 128 | +0.5% | 0.1% |
| 38 | 🇹🇩 Chad | 124 | +6.2% | 0.1% |
| 39 | 🇬🇶 Equatorial Guinea | 119 | -9.2% | 0.1% |
| 40 | 🇸🇾 Syria | 93 | -2.7% | 0.1% |
| 41 | 🇮🇹 Italy | 92 | -7.9% | 0.1% |
| 42 | 🇧🇳 Brunei | 92 | -13.8% | 0.1% |
| 43 | 🇾🇪 Yemen | 81 | -2.4% | 0.1% |
| 44 | 🇹🇹 Trinidad & Tobago | 74 | -3.6% | 0.1% |
| 45 | 🇷🇴 Romania | 65 | -6.2% | 0.1% |
| 46 | 🇩🇰 Denmark | 65 | -1.6% | 0.1% |
| 47 | 🇺🇿 Uzbekistan | 63 | -0.9% | 0.1% |
| 48 | 🇸🇩 Sudan | 62 | -3.3% | 0.1% |
| 49 | 🇹🇳 Tunisia | 40 | -12.9% | 0.0% |
| 50 | Other CIS | 43 | +4.4% | 0.0% |
| 51 | Other Middle East | 210 | +1.2% | 0.2% |
| 52 | Other Africa | 283 | -3.4% | 0.3% |
| 53 | Other Europe | 230 | -20.5% | 0.2% |
| 54 | Other Asia Pacific | 177 | -10.6% | 0.2% |
| 55 | Other S. & Cent. America | 381 | +68.5% | 0.4% |
| Total World | 93,848 | +4.2% | 100.0% |
Behind America’s considerable lead in oil production, Saudi Arabia (ranked 2nd) produced 12 million B/D, accounting for about 13% of global supply.
Russia came in third with 11 million B/D in 2022. Together, these top three oil producing behemoths, along with Canada (4th) and Iraq (5th), make up more than half of the entire world’s oil supply.
Meanwhile, the top 10 oil producers, including those ranked 6th to 10th—China, UAE, Iran, Brazil, and Kuwait—are responsible for more than 70% of the world’s oil production.
Notably, all top 10 oil giants increased their production between 2021–2022, and as a result, global output rose 4.2% year-on-year.
Major Oil Producing Regions in 2022
The Middle East accounts for one-third of global oil production and North America makes up almost another one-third of production. The Commonwealth of Independent States—an organization of post-Soviet Union countries—is another major regional producer of oil, with a 15% share of world production.
| Region | 2022 Production (Thousand B/D) | YoY Change | Share of World Supply |
|---|---|---|---|
| Middle East | 30,743 | +9.2% | 32.8% |
| North America | 25,290 | +5.3% | 27.0% |
| CIS | 14,006 | +0.9% | 14.9% |
| Africa | 7,043 | -3.5% | 7.5% |
| Asia Pacific | 7,273 | -1.4% | 7.8% |
| South & Central America | 6,361 | 7.2% | 6.8% |
| Europe | 3,131 | -8.6% | 3.3% |
What’s starkly apparent in the data however is Europe’s declining share of oil production, now at 3% of the world’s supply. In the last 20 years the EU’s oil output has dropped by more than 50% due to a variety of factors, including stricter environmental regulations and a shift to natural gas.
Another lens to look at regional production is through OPEC members, which control about 35% of the world’s oil output and about 70% of the world’s oil reserves.
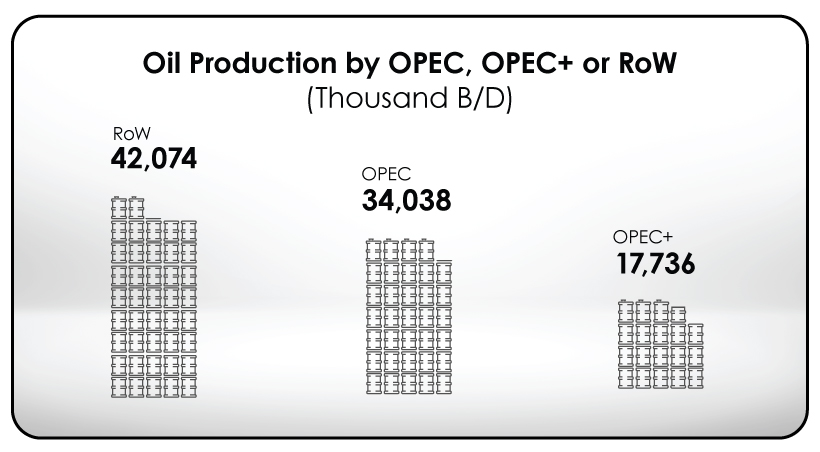
When taking into account the group of 10 oil exporting countries OPEC has relationships with, known as OPEC+, the share of oil production increases to more than half of the world’s supply.
Oil’s Big Balancing Act
Since it’s the very lifeblood of the modern economy, the countries that control significant amounts of oil production also reap immense political and economic benefits. Entire regions have been catapulted into prosperity and wars have been fought over the control of the resource.
At the same time, the ongoing effort to pivot to renewable energy is pushing many major oil exporters to diversify their economies. A notable example is Saudi Arabia, whose sovereign wealth fund has invested in companies like Uber and WeWork.
However, the world still needs oil, as it supplies nearly one-third of global energy demand.


Energy Shift
The World’s Biggest Oil Producers in 2023
Just three countries accounted for 40% of global oil production last year.

The World’s Biggest Oil Producers in 2023
This was originally posted on our Voronoi app. Download the app for free on iOS or Android and discover incredible data-driven charts from a variety of trusted sources.
Despite efforts to decarbonize the global economy, oil still remains one of the world’s most important resources. It’s also produced by a fairly limited group of countries, which can be a source of economic and political leverage.
This graphic illustrates global crude oil production in 2023, measured in million barrels per day, sourced from the U.S. Energy Information Administration (EIA).
Three Countries Account for 40% of Global Oil Production
In 2023, the United States, Russia, and Saudi Arabia collectively contributed 32.7 million barrels per day to global oil production.
| Oil Production 2023 | Million barrels per day |
|---|---|
| 🇺🇸 U.S. | 12.9 |
| 🇷🇺 Russia | 10.1 |
| 🇸🇦 Saudi Arabia | 9.7 |
| 🇨🇦 Canada | 4.6 |
| 🇮🇶 Iraq | 4.3 |
| 🇨🇳 China | 4.2 |
| 🇮🇷 Iran | 3.6 |
| 🇧🇷 Brazil | 3.4 |
| 🇦🇪 UAE | 3.4 |
| 🇰🇼 Kuwait | 2.7 |
| 🌍 Other | 22.8 |
These three nations have consistently dominated oil production since 1971. The leading position, however, has alternated among them over the past five decades.
In contrast, the combined production of the next three largest producers—Canada, Iraq, and China—reached 13.1 million barrels per day in 2023, just surpassing the production of the United States alone.
In the near term, no country is likely to surpass the record production achieved by the U.S. in 2023, as no other producer has ever reached a daily capacity of 13.0 million barrels. Recently, Saudi Arabia’s state-owned Saudi Aramco scrapped plans to increase production capacity to 13.0 million barrels per day by 2027.
In 2024, analysts forecast that the U.S. will maintain its position as the top oil producer. In fact, according to Macquarie Group, U.S. oil production is expected to achieve a record pace of about 14 million barrels per day by the end of the year.
Energy Shift
How Much Does the U.S. Depend on Russian Uranium?
Despite a new uranium ban being discussed in Congress, the U.S. is still heavily dependent on Russian uranium.

How Much Does the U.S. Depend on Russian Uranium?
This was originally posted on our Voronoi app. Download the app for free on iOS or Android and discover incredible data-driven charts from a variety of trusted sources.
The U.S. House of Representatives recently passed a ban on imports of Russian uranium. The bill must pass the Senate before becoming law.
In this graphic, we visualize how much the U.S. relies on Russian uranium, based on data from the United States Energy Information Administration (EIA).
U.S. Suppliers of Enriched Uranium
After Russia invaded Ukraine, the U.S. imposed sanctions on Russian-produced oil and gas—yet Russian-enriched uranium is still being imported.
Currently, Russia is the largest foreign supplier of nuclear power fuel to the United States. In 2022, Russia supplied almost a quarter of the enriched uranium used to fuel America’s fleet of more than 90 commercial reactors.
| Country of enrichment service | SWU* | % |
|---|---|---|
| 🇺🇸 United States | 3,876 | 27.34% |
| 🇷🇺 Russia | 3,409 | 24.04% |
| 🇩🇪 Germany | 1,763 | 12.40% |
| 🇬🇧 United Kingdom | 1,593 | 11.23% |
| 🇳🇱 Netherlands | 1,303 | 9.20% |
| Other | 2,232 | 15.79% |
| Total | 14,176 | 100% |
SWU stands for “Separative Work Unit” in the uranium industry. It is a measure of the amount of work required to separate isotopes of uranium during the enrichment process. Source: U.S. Energy Information Administration
Most of the remaining uranium is imported from European countries, while another portion is produced by a British-Dutch-German consortium operating in the United States called Urenco.
Similarly, nearly a dozen countries around the world depend on Russia for more than half of their enriched uranium—and many of them are NATO-allied members and allies of Ukraine.
In 2023 alone, the U.S. nuclear industry paid over $800 million to Russia’s state-owned nuclear energy corporation, Rosatom, and its fuel subsidiaries.
It is important to note that 19% of electricity in the U.S. is powered by nuclear plants.
The dependency on Russian fuels dates back to the 1990s when the United States turned away from its own enrichment capabilities in favor of using down-blended stocks of Soviet-era weapons-grade uranium.
As part of the new uranium-ban bill, the Biden administration plans to allocate $2.2 billion for the expansion of uranium enrichment facilities in the United States.

-

 Electrification3 years ago
Ranked: The Top 10 EV Battery Manufacturers
-

 Electrification2 years ago
The Key Minerals in an EV Battery
-

 Real Assets3 years ago
The World’s Top 10 Gold Mining Companies
-

 Misc3 years ago
All the Metals We Mined in One Visualization
-

 Electrification3 years ago
The Biggest Mining Companies in the World in 2021
-

 Energy Shift2 years ago
What Are the Five Major Types of Renewable Energy?
-

 Electrification2 years ago
Mapped: Solar Power by Country in 2021
-

 Electrification2 years ago
The World’s Largest Nickel Mining Companies