

Energy Shift
Who’s Still Buying Russian Fossil Fuels in 2023?
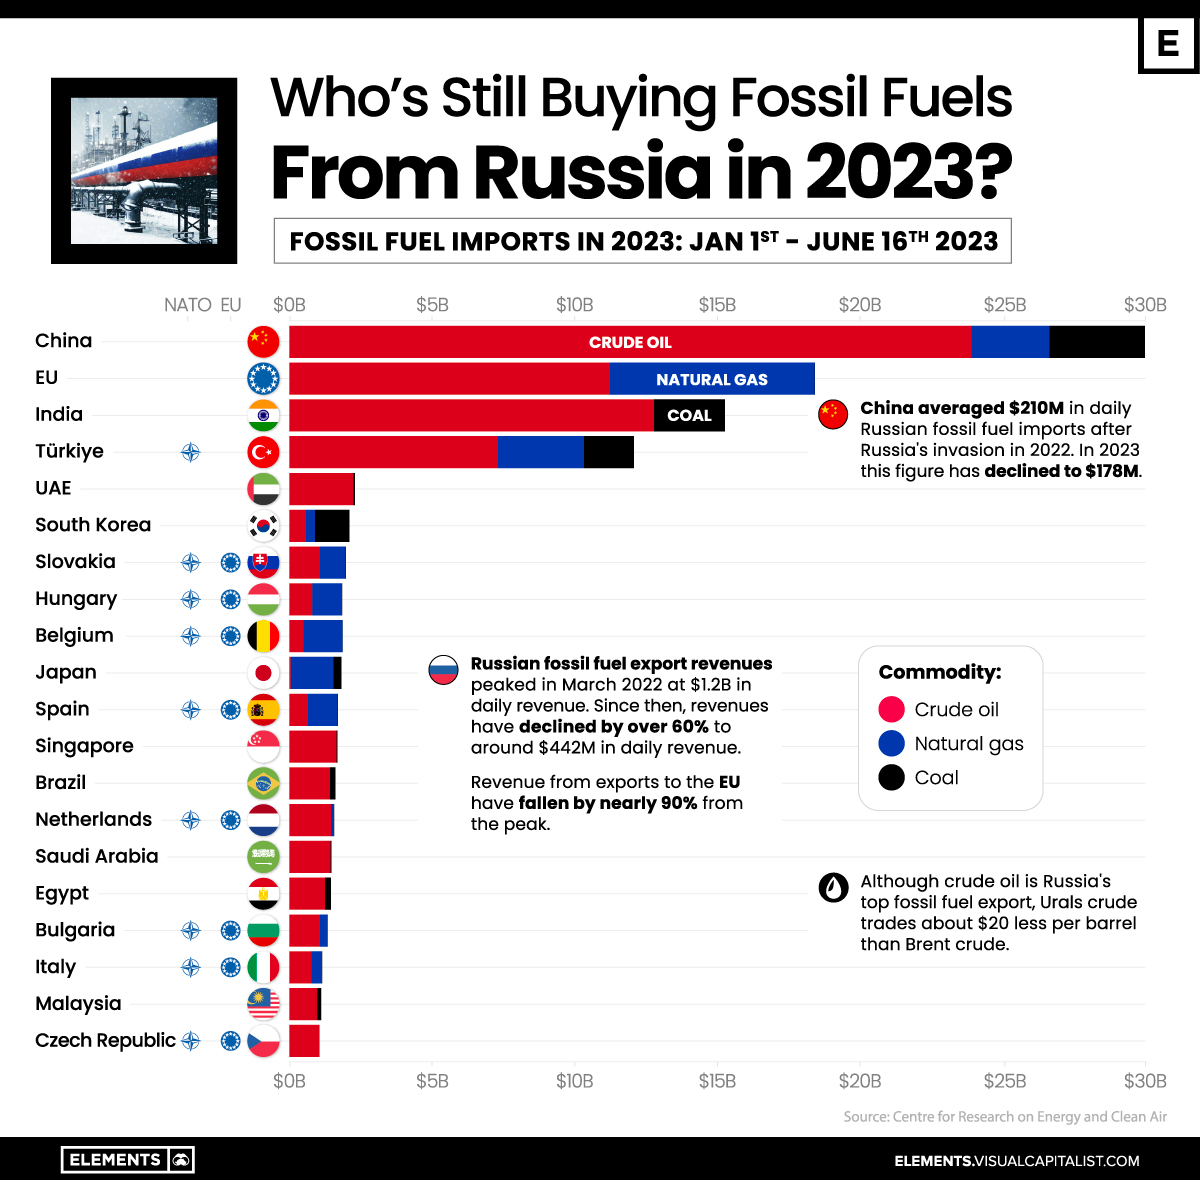
The Countries Buying Fossil Fuels from Russia in 2023
While Russia’s revenues from fossil fuel exports have declined significantly since their peak in March of 2022, many countries are still importing millions of dollars a day worth of fossil fuels from Russia.
Revenue from fossil fuels exported to the EU has declined more than 90% from their peak, but in 2023 the bloc has still imported more than $18 billion of crude oil and natural gas so far.
This graphic uses data from the Centre for Research on Energy and Clean Air (CREA) to visualize the top-importing countries of fossil fuels from Russia so far this year.
China Remains Russia’s Top Fossil Fuel Importer
China continues to be Russia’s top buyer of fossil fuels, with imports reaching $30 billion in 2023 up until June 16, 2023.
With nearly 80% of China’s fuel imports being crude oil, Russia’s average daily revenues from Chinese fossil fuel imports have declined from $210 million in 2022 to $178 million in 2023 largely due to the falling price of Russian crude oil.
Following China are EU nations collectively, which despite no longer importing coal from Russia since August of 2022, still imported $18.4 billion of fossil fuels in a 60/40 split of crude oil and natural gas respectively.
| Country | Russian Fossil Fuel Imports* (Total) | Crude Oil | Natural Gas | Coal | |||||||||
|---|---|---|---|---|---|---|---|---|---|---|---|---|---|
| 🇨🇳 China | $30.0B | $23.9B | $2.7B | $3.3B | |||||||||
| 🇪🇺 EU | $18.4B | $11.2B | $7.2B | $0 | |||||||||
| 🇮🇳 India | $15.2B | $12.8B | $0 | $2.5B | |||||||||
| 🇹🇷 Türkiye | $12.1B | $7.3B | $3B | $1.7B | |||||||||
| 🇦🇪 UAE | $2.3B | $2.3B | $0 | $0 | |||||||||
| 🇰🇷 South Korea | $2.1B | $0.6B | $0.3B | $1.2B | |||||||||
| 🇸🇰 Slovakia | $2.0B | $1.1B | $0.9B | $0 | |||||||||
| 🇭🇺 Hungary | $1.9B | $0.8B | $1.1B | $0 | |||||||||
| 🇧🇪 Belgium | $1.9B | $0.5B | $1.4B | $0 | |||||||||
| 🇯🇵 Japan | $1.8B | $0 | $1.5B | $0.3B | |||||||||
| 🇪🇸 Spain | $1.7B | $0.6B | $1.1B | $0 | |||||||||
| 🇸🇬 Singapore | $1.7B | $1.7B | $0 | $0 | |||||||||
| 🇧🇷 Brazil | $1.6B | $1.4B | $0 | $0.2B | |||||||||
| 🇳🇱 Netherlands | $1.6B | $1.5B | $0.1B | $0 | |||||||||
| 🇸🇦 Saudi Arabia | $1.5B | $1.4B | $0 | $0 | |||||||||
| 🇪🇬 Egypt | $1.4B | $1.3B | $0 | $0.2B | |||||||||
| 🇧🇬 Bulgaria | $1.3B | $1.1B | $0.3B | $0 | |||||||||
| 🇮🇹 Italy | $1.2B | $0.8B | $0.4B | $0 | |||||||||
| 🇲🇾 Malaysia | $1.1B | $1.0B | $0 | $0.1B | |||||||||
| 🇨🇿 Czech Republic | $1.0B | $1.1B | $0 | $0 |
*Over the time period of Jan 1, 2023 to June 16, 2023 in U.S. dollars
After China and the EU bloc, India is the next-largest importer of Russian fossil fuels, having ramped up the amount of fossil fuels imported by more than 10x since before Russia’s invasion of Ukraine, largely due to discounted Russian oil.
Türkiye is the only other nation to have imported more than $10 billion worth of Russian fossil fuels in 2023, with every other country having imported fewer than $3 billion worth of fuels from Russia this year.
Navigating the Crude Reality of Oil Exports
Although crude oil is Russia’s chief fossil fuel export, the nation’s Urals crude traded at a $20 per barrel discount to Brent crude throughout most of 2023. While this discount has narrowed to around $16 following Russia’s announcement of further oil export cuts of 500,000 bpd (barrels per day), the price of Urals crude oil remains just 40 cents below the $60 price cap put in place by G7 and EU nations.
Alongside Russia, Saudi Arabia also announced it would extend its cut of 1 million bpd until the end of August, with Saudi Energy Minister Prince Abdulaziz bin Salman commenting on the country’s solidarity with Russia and saying it would do “whatever is necessary” to support the oil market.
While OPEC and OPEC+ nations’ cuts are an attempt at pushing crude oil prices up, increased production from the U.S. has counteracted this. The EIA forecasts 2023 U.S. production to be 12.6 million bpd, surpassing the high in 2019 of 12.3 million bpd.


Energy Shift
The World’s Biggest Oil Producers in 2023
Just three countries accounted for 40% of global oil production last year.

The World’s Biggest Oil Producers in 2023
This was originally posted on our Voronoi app. Download the app for free on iOS or Android and discover incredible data-driven charts from a variety of trusted sources.
Despite efforts to decarbonize the global economy, oil still remains one of the world’s most important resources. It’s also produced by a fairly limited group of countries, which can be a source of economic and political leverage.
This graphic illustrates global crude oil production in 2023, measured in million barrels per day, sourced from the U.S. Energy Information Administration (EIA).
Three Countries Account for 40% of Global Oil Production
In 2023, the United States, Russia, and Saudi Arabia collectively contributed 32.7 million barrels per day to global oil production.
| Oil Production 2023 | Million barrels per day |
|---|---|
| 🇺🇸 U.S. | 12.9 |
| 🇷🇺 Russia | 10.1 |
| 🇸🇦 Saudi Arabia | 9.7 |
| 🇨🇦 Canada | 4.6 |
| 🇮🇶 Iraq | 4.3 |
| 🇨🇳 China | 4.2 |
| 🇮🇷 Iran | 3.6 |
| 🇧🇷 Brazil | 3.4 |
| 🇦🇪 UAE | 3.4 |
| 🇰🇼 Kuwait | 2.7 |
| 🌍 Other | 22.8 |
These three nations have consistently dominated oil production since 1971. The leading position, however, has alternated among them over the past five decades.
In contrast, the combined production of the next three largest producers—Canada, Iraq, and China—reached 13.1 million barrels per day in 2023, just surpassing the production of the United States alone.
In the near term, no country is likely to surpass the record production achieved by the U.S. in 2023, as no other producer has ever reached a daily capacity of 13.0 million barrels. Recently, Saudi Arabia’s state-owned Saudi Aramco scrapped plans to increase production capacity to 13.0 million barrels per day by 2027.
In 2024, analysts forecast that the U.S. will maintain its position as the top oil producer. In fact, according to Macquarie Group, U.S. oil production is expected to achieve a record pace of about 14 million barrels per day by the end of the year.
Energy Shift
How Much Does the U.S. Depend on Russian Uranium?
Despite a new uranium ban being discussed in Congress, the U.S. is still heavily dependent on Russian uranium.

How Much Does the U.S. Depend on Russian Uranium?
This was originally posted on our Voronoi app. Download the app for free on iOS or Android and discover incredible data-driven charts from a variety of trusted sources.
The U.S. House of Representatives recently passed a ban on imports of Russian uranium. The bill must pass the Senate before becoming law.
In this graphic, we visualize how much the U.S. relies on Russian uranium, based on data from the United States Energy Information Administration (EIA).
U.S. Suppliers of Enriched Uranium
After Russia invaded Ukraine, the U.S. imposed sanctions on Russian-produced oil and gas—yet Russian-enriched uranium is still being imported.
Currently, Russia is the largest foreign supplier of nuclear power fuel to the United States. In 2022, Russia supplied almost a quarter of the enriched uranium used to fuel America’s fleet of more than 90 commercial reactors.
| Country of enrichment service | SWU* | % |
|---|---|---|
| 🇺🇸 United States | 3,876 | 27.34% |
| 🇷🇺 Russia | 3,409 | 24.04% |
| 🇩🇪 Germany | 1,763 | 12.40% |
| 🇬🇧 United Kingdom | 1,593 | 11.23% |
| 🇳🇱 Netherlands | 1,303 | 9.20% |
| Other | 2,232 | 15.79% |
| Total | 14,176 | 100% |
SWU stands for “Separative Work Unit” in the uranium industry. It is a measure of the amount of work required to separate isotopes of uranium during the enrichment process. Source: U.S. Energy Information Administration
Most of the remaining uranium is imported from European countries, while another portion is produced by a British-Dutch-German consortium operating in the United States called Urenco.
Similarly, nearly a dozen countries around the world depend on Russia for more than half of their enriched uranium—and many of them are NATO-allied members and allies of Ukraine.
In 2023 alone, the U.S. nuclear industry paid over $800 million to Russia’s state-owned nuclear energy corporation, Rosatom, and its fuel subsidiaries.
It is important to note that 19% of electricity in the U.S. is powered by nuclear plants.
The dependency on Russian fuels dates back to the 1990s when the United States turned away from its own enrichment capabilities in favor of using down-blended stocks of Soviet-era weapons-grade uranium.
As part of the new uranium-ban bill, the Biden administration plans to allocate $2.2 billion for the expansion of uranium enrichment facilities in the United States.

-

 Electrification3 years ago
Ranked: The Top 10 EV Battery Manufacturers
-

 Electrification2 years ago
The Key Minerals in an EV Battery
-

 Real Assets3 years ago
The World’s Top 10 Gold Mining Companies
-

 Misc3 years ago
All the Metals We Mined in One Visualization
-

 Electrification3 years ago
The Biggest Mining Companies in the World in 2021
-

 Energy Shift2 years ago
What Are the Five Major Types of Renewable Energy?
-

 Electrification2 years ago
Mapped: Solar Power by Country in 2021
-

 Electrification2 years ago
The World’s Largest Nickel Mining Companies