

Energy Shift
Which Countries Are Most Reliant on Coal?


Which Countries Are Most Reliant on Coal?
Global energy policies and discussions in recent years have been focused on the importance of decarbonizing the energy system in the transition to net zero.
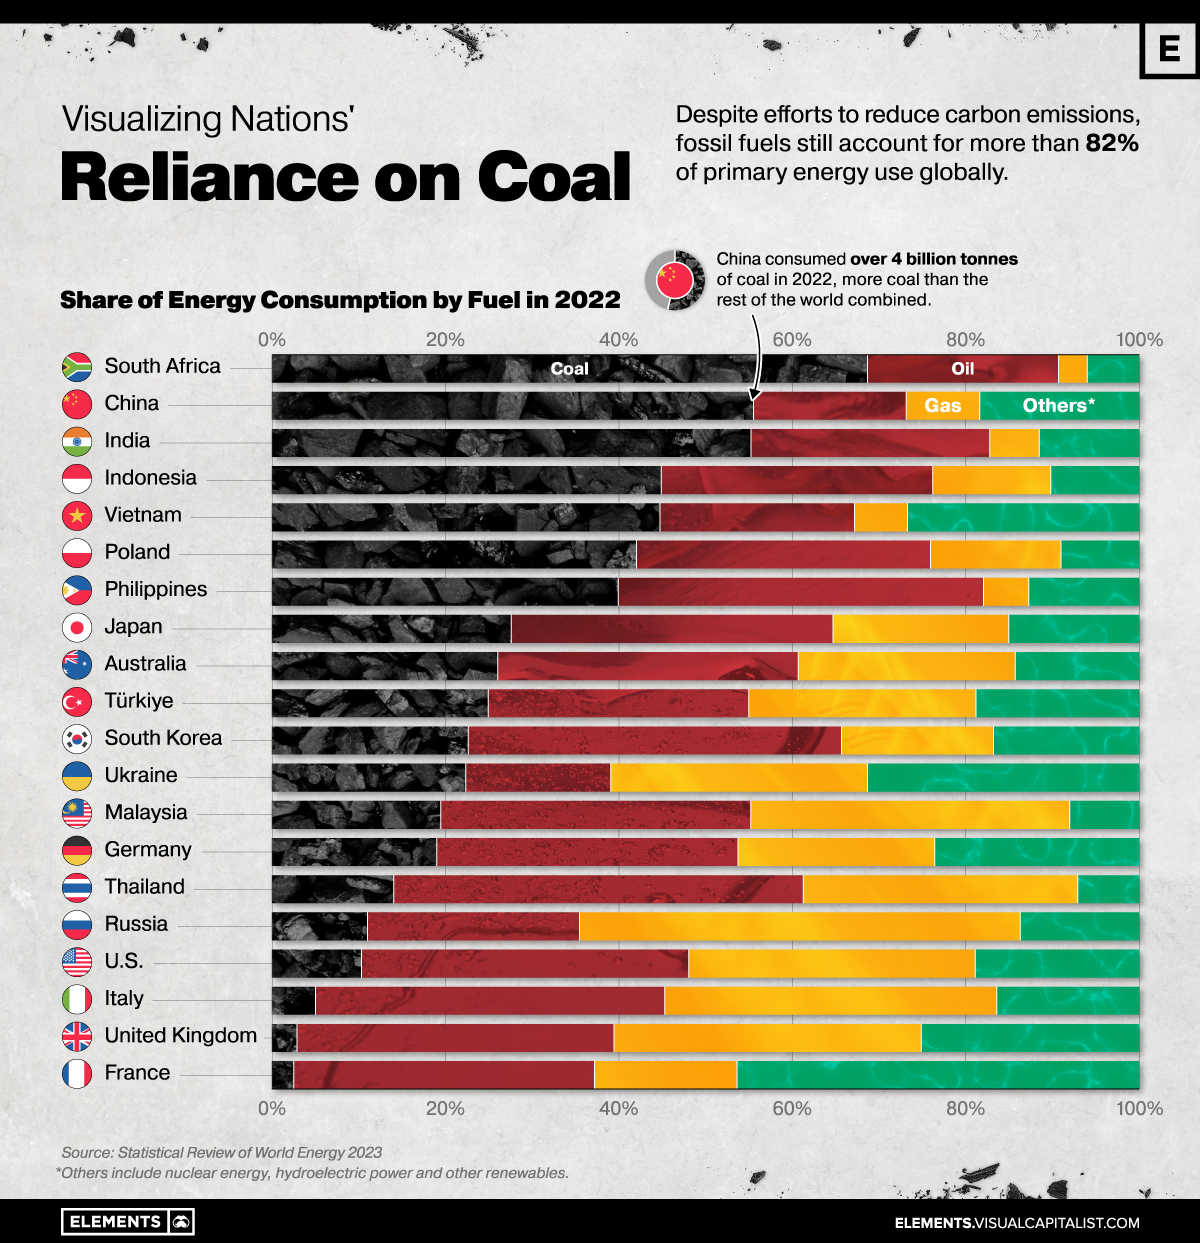
However, despite efforts to reduce carbon emissions, fossil fuels still account for more than 80% of primary energy use globally—and coal, the world’s most affordable energy fuel, is also the largest source of energy-related CO2 emissions.
The graphic above uses data from the Statistical Review of World Energy to show how much select countries rely on fossil fuels, particularly coal.
Coal’s Importance in Emerging Economies
Coal is the largest source of electricity generation and the primary fuel for iron, steel, and cement production, making it central to climate and energy discussions.
The fossil fuel continues to be an affordable and abundant source of energy, particularly in emerging economies where demand is expanding rapidly.
South Africa is the world’s most coal-dependent nation featured in the statistical review, with coal accounting for 69% of its primary energy consumption in 2022.
| Primary energy use, by fuel type (2022) | ||||
|---|---|---|---|---|
| Country | Coal % | Oil % | Gas % | Other % |
| 🇿🇦 South Africa | 69% | 22% | 3% | 6% |
| 🇨🇳 China | 55% | 18% | 8% | 18% |
| 🇮🇳 India | 55% | 27% | 6% | 11% |
| 🇮🇩 Indonesia | 45% | 31% | 14% | 10% |
| 🇻🇳 Vietnam | 45% | 22% | 6% | 27% |
| 🇵🇱 Poland | 42% | 34% | 15% | 9% |
| 🇵🇭 Philippines | 40% | 42% | 5% | 13% |
| 🇯🇵 Japan | 27% | 37% | 20% | 15% |
| 🇦🇺 Australia | 26% | 35% | 25% | 14% |
| 🇹🇷 Türkiye | 25% | 30% | 26% | 19% |
| 🇰🇷 South Korea | 23% | 43% | 17% | 17% |
| 🇺🇦 Ukraine | 22% | 17% | 30% | 31% |
| 🇲🇾 Malaysia | 19% | 36% | 37% | 8% |
| 🇩🇪 Germany | 19% | 35% | 23% | 23% |
| 🇹🇭 Thailand | 14% | 47% | 32% | 7% |
| 🇷🇺 Russia | 11% | 24% | 51% | 14% |
| 🇺🇸 U.S. | 10% | 38% | 33% | 19% |
| 🇮🇹 Italy | 5% | 40% | 38% | 16% |
| 🇬🇧 United Kingdom | 3% | 36% | 35% | 25% |
| 🇫🇷 France | 2% | 35% | 16% | 46% |
Percentages may not add to 100 due to rounding. Select countries shown above.
In 2022, global consumption of coal surpassed 8 billion tonnes in a single year for the first time, with China and India being the two biggest consumers in absolute terms.
China’s power sector alone accounts for one-third of global coal consumption. Meanwhile, with a growth rate of 6% annually, India has doubled its coal consumption since 2007—and is expected to lead the growth in coal consumption for years to come.
Coal Demand in Developed Countries
U.S. consumption of coal has dropped almost 50% compared to the early 2010s.
With initiatives like the Inflation Reduction Act (IRA), which includes nearly $370 billion to accelerate the U.S.’s energy transition, coal consumption is expected to remain on a downward trajectory in the United States.
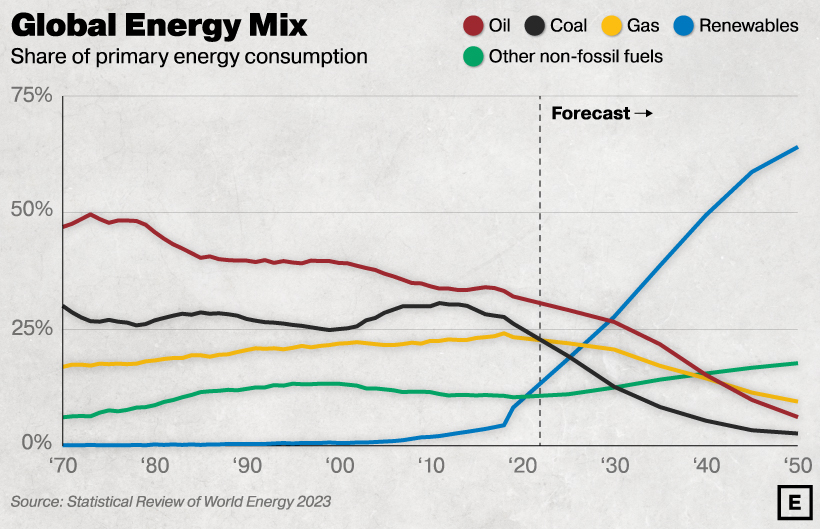
Source: BP Energy Outlook 2023. The forecast is based on BP’s scenario for global net-zero emissions by 2050.
The same movement is seen in the European Union.
France, for example, only has 2.5% of its primary energy consumption coming from coal, a share that is just half of what it was in the early 2000s.
In Germany, Europe’s biggest economy, coal still accounts for 18.9% of total energy consumption (a small increase over 2021, due to the energy crisis). However, a decade ago in 2012, that number stood even higher at 24.9% of primary energy use.
With coal consumption falling in developed nations but remaining steady in emerging economies, the International Energy Agency projects that coal demand will plateau at 2022 levels until 2025 when it will begin to fall.


Energy Shift
The World’s Biggest Oil Producers in 2023
Just three countries accounted for 40% of global oil production last year.

The World’s Biggest Oil Producers in 2023
This was originally posted on our Voronoi app. Download the app for free on iOS or Android and discover incredible data-driven charts from a variety of trusted sources.
Despite efforts to decarbonize the global economy, oil still remains one of the world’s most important resources. It’s also produced by a fairly limited group of countries, which can be a source of economic and political leverage.
This graphic illustrates global crude oil production in 2023, measured in million barrels per day, sourced from the U.S. Energy Information Administration (EIA).
Three Countries Account for 40% of Global Oil Production
In 2023, the United States, Russia, and Saudi Arabia collectively contributed 32.7 million barrels per day to global oil production.
| Oil Production 2023 | Million barrels per day |
|---|---|
| 🇺🇸 U.S. | 12.9 |
| 🇷🇺 Russia | 10.1 |
| 🇸🇦 Saudi Arabia | 9.7 |
| 🇨🇦 Canada | 4.6 |
| 🇮🇶 Iraq | 4.3 |
| 🇨🇳 China | 4.2 |
| 🇮🇷 Iran | 3.6 |
| 🇧🇷 Brazil | 3.4 |
| 🇦🇪 UAE | 3.4 |
| 🇰🇼 Kuwait | 2.7 |
| 🌍 Other | 22.8 |
These three nations have consistently dominated oil production since 1971. The leading position, however, has alternated among them over the past five decades.
In contrast, the combined production of the next three largest producers—Canada, Iraq, and China—reached 13.1 million barrels per day in 2023, just surpassing the production of the United States alone.
In the near term, no country is likely to surpass the record production achieved by the U.S. in 2023, as no other producer has ever reached a daily capacity of 13.0 million barrels. Recently, Saudi Arabia’s state-owned Saudi Aramco scrapped plans to increase production capacity to 13.0 million barrels per day by 2027.
In 2024, analysts forecast that the U.S. will maintain its position as the top oil producer. In fact, according to Macquarie Group, U.S. oil production is expected to achieve a record pace of about 14 million barrels per day by the end of the year.
Energy Shift
How Much Does the U.S. Depend on Russian Uranium?
Despite a new uranium ban being discussed in Congress, the U.S. is still heavily dependent on Russian uranium.

How Much Does the U.S. Depend on Russian Uranium?
This was originally posted on our Voronoi app. Download the app for free on iOS or Android and discover incredible data-driven charts from a variety of trusted sources.
The U.S. House of Representatives recently passed a ban on imports of Russian uranium. The bill must pass the Senate before becoming law.
In this graphic, we visualize how much the U.S. relies on Russian uranium, based on data from the United States Energy Information Administration (EIA).
U.S. Suppliers of Enriched Uranium
After Russia invaded Ukraine, the U.S. imposed sanctions on Russian-produced oil and gas—yet Russian-enriched uranium is still being imported.
Currently, Russia is the largest foreign supplier of nuclear power fuel to the United States. In 2022, Russia supplied almost a quarter of the enriched uranium used to fuel America’s fleet of more than 90 commercial reactors.
| Country of enrichment service | SWU* | % |
|---|---|---|
| 🇺🇸 United States | 3,876 | 27.34% |
| 🇷🇺 Russia | 3,409 | 24.04% |
| 🇩🇪 Germany | 1,763 | 12.40% |
| 🇬🇧 United Kingdom | 1,593 | 11.23% |
| 🇳🇱 Netherlands | 1,303 | 9.20% |
| Other | 2,232 | 15.79% |
| Total | 14,176 | 100% |
SWU stands for “Separative Work Unit” in the uranium industry. It is a measure of the amount of work required to separate isotopes of uranium during the enrichment process. Source: U.S. Energy Information Administration
Most of the remaining uranium is imported from European countries, while another portion is produced by a British-Dutch-German consortium operating in the United States called Urenco.
Similarly, nearly a dozen countries around the world depend on Russia for more than half of their enriched uranium—and many of them are NATO-allied members and allies of Ukraine.
In 2023 alone, the U.S. nuclear industry paid over $800 million to Russia’s state-owned nuclear energy corporation, Rosatom, and its fuel subsidiaries.
It is important to note that 19% of electricity in the U.S. is powered by nuclear plants.
The dependency on Russian fuels dates back to the 1990s when the United States turned away from its own enrichment capabilities in favor of using down-blended stocks of Soviet-era weapons-grade uranium.
As part of the new uranium-ban bill, the Biden administration plans to allocate $2.2 billion for the expansion of uranium enrichment facilities in the United States.

-

 Electrification3 years ago
Ranked: The Top 10 EV Battery Manufacturers
-

 Electrification2 years ago
The Key Minerals in an EV Battery
-

 Real Assets3 years ago
The World’s Top 10 Gold Mining Companies
-

 Misc3 years ago
All the Metals We Mined in One Visualization
-

 Electrification3 years ago
The Biggest Mining Companies in the World in 2021
-

 Energy Shift2 years ago
What Are the Five Major Types of Renewable Energy?
-

 Electrification2 years ago
Mapped: Solar Power by Country in 2021
-

 Electrification2 years ago
The World’s Largest Nickel Mining Companies