

Energy Shift
How Mine Permitting Delays Impact the Transition to a Green Economy
The following content is sponsored by Northern Dynasty
Mine Permitting Delays and the Transition to a Green Economy
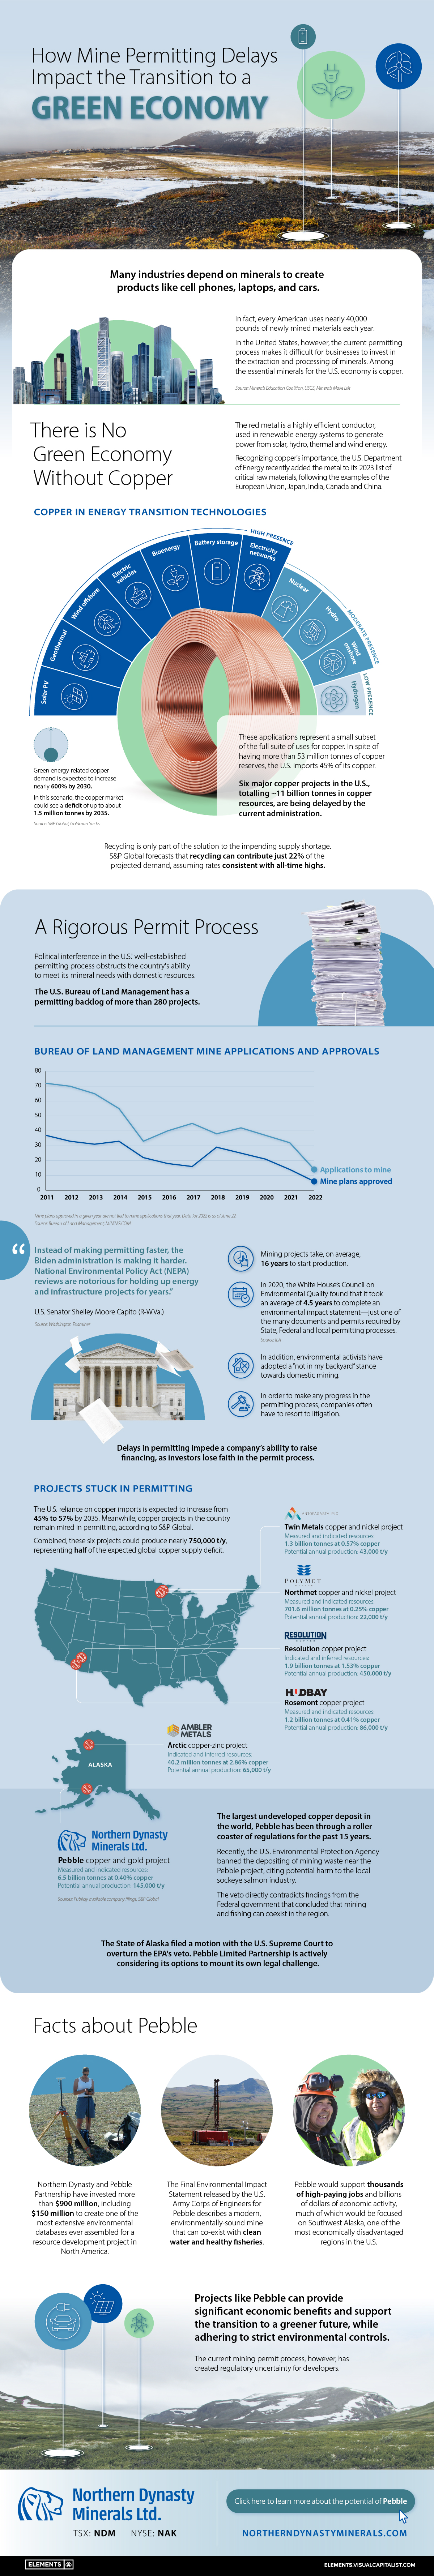
Minerals are essential components in many of our daily-use products, such as cell phones, laptops, and cars.
In fact, every American uses nearly 40,000 pounds of newly mined materials each year.
In the United States, however, the current permitting process makes it difficult for businesses to invest in the extraction and processing of minerals, such as copper.
This graphic by Northern Dynasty explores the untapped potential of mineral resources in America.
Copper, a Critical Material
In 2023 the U.S. Department of Energy officially added copper to its critical materials list, following the examples of the European Union, Japan, India, Canada, and China.
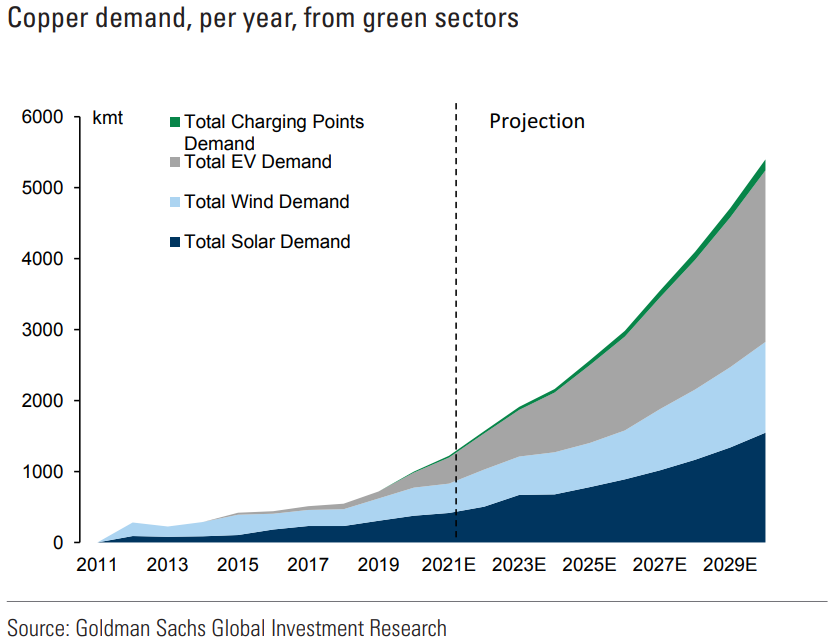
Copper is a highly efficient conductor of electricity and is considered vital for clean energy technologies such as solar, wind energy, and electric vehicles.
Green energy-related copper demand is expected to increase by nearly 600% by 2030. In this scenario, the copper market could see an annual deficit of up to about 1.5 million tonnes by 2035.
Despite having more than 53 million tons of copper reserves, the U.S. imports 45% of its copper from other countries.
This is the highest level of import reliance in over 30 years. One of the biggest reasons for this is the country’s mine permitting process.
A Rigorous Mine Permitting Process
Mines are large-scale projects that demand extensive research and policies. As a result, mining projects can take 16 years, or more, to start production.
Currently, the U.S. Bureau of Land Management—which regulates land use in the country—has a permitting backlog of more than 280 mining projects.
In addition, environmental activists have adopted a “not in my backyard” stance towards domestic mining. As a result, companies have often had to resort to litigation to make any progress in the permitting process.
“Activists have weaponized the government bodies that are essential to the safe and responsible development of domestic mines,” says Michael Westerlund, VP Investor Relations at Northern Dynasty Minerals.
The company owns the largest undeveloped copper deposit in the world, named Pebble, in Alaska. Pebble and other five major copper projects totaling over 11 billion tonnes in copper resources have been delayed because of the Federal permitting process.
The Largest Undeveloped Copper Deposit in the World
The Pebble Project has been through a roller coaster of regulatory activity for the past 15 years.
Recently, the U.S. Environmental Protection Agency banned the depositing of mining waste near the mining project in Alaska, citing potential harm to the local sockeye salmon industry.
However, the veto directly contradicts findings from the Federal government that concluded that mining and fishing could coexist in the region.
“Alaska does resource development better than any other place on the planet, and our opportunities to show the world a better way to extract our resources should not be unfairly preempted by the Federal Government”
–Alaska Governor Mike Dunleavy
Projects like Pebble can provide significant economic benefits and support the U.S. transition to a greener future. With the current regulatory uncertainty for U.S. developers, where the much-needed supply of copper will come from is unknown.
Click here to learn more about Pebble.


Energy Shift
The World’s Biggest Oil Producers in 2023
Just three countries accounted for 40% of global oil production last year.

The World’s Biggest Oil Producers in 2023
This was originally posted on our Voronoi app. Download the app for free on iOS or Android and discover incredible data-driven charts from a variety of trusted sources.
Despite efforts to decarbonize the global economy, oil still remains one of the world’s most important resources. It’s also produced by a fairly limited group of countries, which can be a source of economic and political leverage.
This graphic illustrates global crude oil production in 2023, measured in million barrels per day, sourced from the U.S. Energy Information Administration (EIA).
Three Countries Account for 40% of Global Oil Production
In 2023, the United States, Russia, and Saudi Arabia collectively contributed 32.7 million barrels per day to global oil production.
| Oil Production 2023 | Million barrels per day |
|---|---|
| 🇺🇸 U.S. | 12.9 |
| 🇷🇺 Russia | 10.1 |
| 🇸🇦 Saudi Arabia | 9.7 |
| 🇨🇦 Canada | 4.6 |
| 🇮🇶 Iraq | 4.3 |
| 🇨🇳 China | 4.2 |
| 🇮🇷 Iran | 3.6 |
| 🇧🇷 Brazil | 3.4 |
| 🇦🇪 UAE | 3.4 |
| 🇰🇼 Kuwait | 2.7 |
| 🌍 Other | 22.8 |
These three nations have consistently dominated oil production since 1971. The leading position, however, has alternated among them over the past five decades.
In contrast, the combined production of the next three largest producers—Canada, Iraq, and China—reached 13.1 million barrels per day in 2023, just surpassing the production of the United States alone.
In the near term, no country is likely to surpass the record production achieved by the U.S. in 2023, as no other producer has ever reached a daily capacity of 13.0 million barrels. Recently, Saudi Arabia’s state-owned Saudi Aramco scrapped plans to increase production capacity to 13.0 million barrels per day by 2027.
In 2024, analysts forecast that the U.S. will maintain its position as the top oil producer. In fact, according to Macquarie Group, U.S. oil production is expected to achieve a record pace of about 14 million barrels per day by the end of the year.
Energy Shift
How Much Does the U.S. Depend on Russian Uranium?
Despite a new uranium ban being discussed in Congress, the U.S. is still heavily dependent on Russian uranium.

How Much Does the U.S. Depend on Russian Uranium?
This was originally posted on our Voronoi app. Download the app for free on iOS or Android and discover incredible data-driven charts from a variety of trusted sources.
The U.S. House of Representatives recently passed a ban on imports of Russian uranium. The bill must pass the Senate before becoming law.
In this graphic, we visualize how much the U.S. relies on Russian uranium, based on data from the United States Energy Information Administration (EIA).
U.S. Suppliers of Enriched Uranium
After Russia invaded Ukraine, the U.S. imposed sanctions on Russian-produced oil and gas—yet Russian-enriched uranium is still being imported.
Currently, Russia is the largest foreign supplier of nuclear power fuel to the United States. In 2022, Russia supplied almost a quarter of the enriched uranium used to fuel America’s fleet of more than 90 commercial reactors.
| Country of enrichment service | SWU* | % |
|---|---|---|
| 🇺🇸 United States | 3,876 | 27.34% |
| 🇷🇺 Russia | 3,409 | 24.04% |
| 🇩🇪 Germany | 1,763 | 12.40% |
| 🇬🇧 United Kingdom | 1,593 | 11.23% |
| 🇳🇱 Netherlands | 1,303 | 9.20% |
| Other | 2,232 | 15.79% |
| Total | 14,176 | 100% |
SWU stands for “Separative Work Unit” in the uranium industry. It is a measure of the amount of work required to separate isotopes of uranium during the enrichment process. Source: U.S. Energy Information Administration
Most of the remaining uranium is imported from European countries, while another portion is produced by a British-Dutch-German consortium operating in the United States called Urenco.
Similarly, nearly a dozen countries around the world depend on Russia for more than half of their enriched uranium—and many of them are NATO-allied members and allies of Ukraine.
In 2023 alone, the U.S. nuclear industry paid over $800 million to Russia’s state-owned nuclear energy corporation, Rosatom, and its fuel subsidiaries.
It is important to note that 19% of electricity in the U.S. is powered by nuclear plants.
The dependency on Russian fuels dates back to the 1990s when the United States turned away from its own enrichment capabilities in favor of using down-blended stocks of Soviet-era weapons-grade uranium.
As part of the new uranium-ban bill, the Biden administration plans to allocate $2.2 billion for the expansion of uranium enrichment facilities in the United States.

-

 Electrification3 years ago
Ranked: The Top 10 EV Battery Manufacturers
-

 Electrification2 years ago
The Key Minerals in an EV Battery
-

 Real Assets3 years ago
The World’s Top 10 Gold Mining Companies
-

 Misc3 years ago
All the Metals We Mined in One Visualization
-

 Electrification3 years ago
The Biggest Mining Companies in the World in 2021
-

 Energy Shift2 years ago
What Are the Five Major Types of Renewable Energy?
-

 Electrification2 years ago
Mapped: Solar Power by Country in 2021
-

 Electrification2 years ago
The World’s Largest Nickel Mining Companies