

Misc
Brass Rods: The Safe Choice
The following content is sponsored by the Copper Development Association


Brass Rods: The Safe Choice
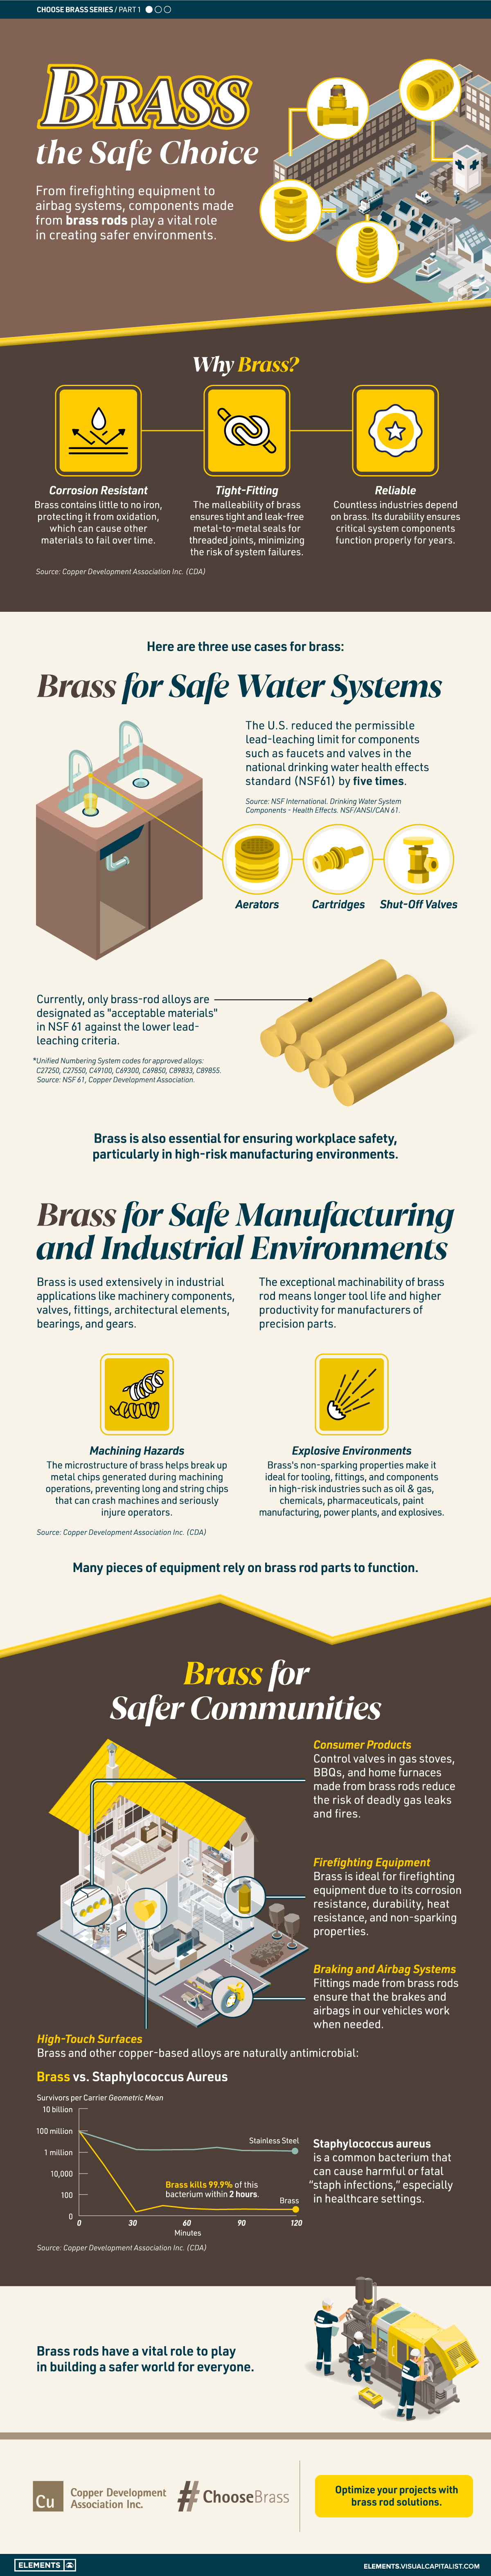
From airbags to firefighting equipment, components made from brass rods play a vital role in creating a safer environment.
This infographic from the Copper Development Association illustrates three use cases for brass. This is the first of three infographics in our Choose Brass series.
Why Brass?
Brass is one of the most reliable metals for industrial and other applications. It contains little to no iron, protecting it from oxidation, which can cause other materials to fail over time.
Additionally, the malleability of brass ensures tight and leak-free metal-to-metal seals for threaded joints, minimizing the risk of costly and dangerous system failures. Brass’s durability ensures critical system components function properly for years.
Brass for Safe Water Systems
Exposure to lead in water can cause various health problems, including neurological damage, developmental delays, and cardiovascular diseases.
As a result, the U.S. sets minimum health-effect requirements for chemical contaminants and impurities indirectly transferred to drinking water from products, components, and materials used in water systems.
Currently, only brass rod alloys are designated as “acceptable materials” according to national standards.
Brass is also essential for ensuring workplace safety, particularly in high-risk manufacturing environments.
Using Brass for Safe Manufacturing and Industrial Environments
Brass is used extensively in industrial applications such as machinery components, valves, fittings, architectural elements, bearings, and gears.
The machinability of brass rods also means longer tool life and higher productivity for manufacturers of precision parts.
The microstructure of brass helps break up metal chips generated during machining operations, preventing long and stringy chips that can crash machines and seriously injure operators.
Additionally, brass’s non-sparking properties make it ideal for tooling, fittings, and components in high-risk industries such as oil & gas, chemicals, pharmaceuticals, paint manufacturing, power plants, and explosives.
Brass for Safer Communities
Many pieces of equipment in our daily lives also rely on brass rod parts to function. Control valves in gas stoves, BBQs, and home furnaces made from brass rods reduce the risk of deadly gas leaks and fires.
Moreover, brass is ideal for firefighting equipment due to its corrosion resistance, durability, heat resistance, and non-sparking properties.
Fittings made from brass rods ensure that the brakes and airbags in our vehicles work when needed.
Brass and other copper-based alloys are also naturally antimicrobial, helping prevent diseases when used in high-touch surfaces such as door handles.
These are only some of the ways that brass rods help build a safer world for everyone.
Explore the Advantages of Brass Rod Solutions.


Misc
Brass Rods: The Secure Choice
This graphic shows why brass rods are the secure choice for precision-machined and forged parts.

Brass Rods: The Secure Choice
The unique combination of machinability and recyclability makes brass rods the secure choice for manufacturers seeking future-proof raw material solutions.
This infographic, from the Copper Development Association, shows three ways brass rods give manufacturers greater control and a license to grow in the competitive market for precision-machined and forged products.
Future-Proof Investments in New Machine Tools
A material’s machinability directly impacts machine throughput, which typically has the largest impact on machine shop profitability.
The high-speed machining capabilities of brass rods maximize machine tool performance, allowing manufacturers to run the material faster and longer without sacrificing tool life, chip formation, or surface quality.
The high machining efficiency of brass leads to reduced per-part costs, quicker return on investment (ROI) for new machine tools, and expanded production capacity for new projects.
Supply Security Through Closed Loop Recycling
Brass, like its parent element copper, can be infinitely recycled.
In 2022, brass- and wire-rod mills accounted for the majority of the 830,000 tonnes of copper recycled from scrap in the U.S.
Given that scrap ratios for machined parts typically range from 60-70% by weight, producing mills benefit from a secure and steady supply of clean scrap returned directly from customers, which is recycled to create new brass rods.
The high residual value of brass scrap creates a strong recycling incentive. Scrap buy back programs give manufacturers greater control over raw material net costs as scrap value is often factored into supplier purchase agreements.
Next Generation Alloys for a Lead-Free Future
Increasingly stringent global regulations continue to pressure manufacturers to minimize the use of materials containing trace amounts of lead and other harmful impurities.
The latest generation of brass-rod alloys is engineered to meet the most demanding criteria for lead leaching in drinking water and other sensitive applications.
Seven brass-rod alloys passed rigorous testing to become the only ‘Acceptable Materials’ against lower lead leaching criteria recently adopted in the national U.S. drinking water quality standard, NSF 61.
Learn more about the advantages of brass rods solutions.
Misc
The State of Copper Recycling in the U.S.
This graphic explores how recycling copper can help address the demand for the metal in the U.S.

The State of Copper Recycling in the U.S.
Copper is essential for a low-carbon economy due to its crucial role in renewable energy technologies.
As a result, many worry that a lack of the metal used in wires and batteries can hurt a transition to a green economy.
In this graphic, our sponsor, the Copper Development Association, explores how recycling can address the demand for copper.
Copper Scrap Recycled in the U.S.
In 2022, the total copper scrap recycled in the U.S. was approximately 830,000 tonnes, equivalent to 32% of the total U.S. copper supply for the same period. Around 670,000 tonnes (81%) originated from pre-consumer sources generated during manufacturing operations, while 160,000 tonnes (19%) came from post-consumer sources, such as obsolete products.
Brass and wire-rod mills accounted for the majority of the copper recycled from scrap (85%). Additionally, smelters, refiners, and ingot makers make 10% and chemical plants, foundries, and other manufacturers around 5%.
| Copper from Scrap | 2022 Content (tonnes) |
|---|---|
| Brass and wire-rod mills | 650,000 t |
| Smelters and refiners | 40,000 t |
| Ingot makers | 39,500 t |
| Foundries, Other | 40,000 t |
Despite the rising demand for copper, the U.S. predominantly exports its copper scrap.
In 2022, the U.S. exported half of the 1,569,000 tonnes of the copper content generated from scrap. This export trend persisted because, until recent years, the country lacked operating secondary copper smelters capable of processing complex scrap grades into furnace-ready raw materials.
However, reshoring this metal presents an opportunity for the country.
Tapping into the Urban Mine
North America currently has about 86 million tonnes (Mt) of copper in use, known as the Urban Mine. This copper will become available for recycling as aging infrastructure and products reach the end of their service lives:
- Buildings: 45.4 Mt
- Infrastructure: 16.1 Mt
- Consumer Products: 11.2 Mt
- Transport: 8.5 Mt
- Industrial Uses: 4.8 Mt
Increased secondary smelting and refining capacity is a crucial building block for a more resilient and self-sufficient U.S. copper supply chain.
In response to the growing need for copper, the U.S. plans to add over 280,000 tonnes of secondary smelting and refining capacity in the next few years. This expansion will enable the country to process more complex scrap grades domestically.
Given that copper products can last for decades, creating a lag time before the material becomes available for recycling, primary production will continue to play an important role in meeting the increasing needs in the U.S.
The Copper Development Association (CDA) brings the value of copper and its alloys to society to address the challenges of today and tomorrow. Visit www.copper.org to learn more about why copper is a critical mineral.

-

 Electrification3 years ago
Ranked: The Top 10 EV Battery Manufacturers
-

 Electrification2 years ago
The Key Minerals in an EV Battery
-

 Real Assets3 years ago
The World’s Top 10 Gold Mining Companies
-

 Misc3 years ago
All the Metals We Mined in One Visualization
-

 Electrification3 years ago
The Biggest Mining Companies in the World in 2021
-

 Energy Shift2 years ago
What Are the Five Major Types of Renewable Energy?
-

 Electrification2 years ago
Mapped: Solar Power by Country in 2021
-

 Electrification2 years ago
The World’s Largest Nickel Mining Companies