

Misc
From Lead to Copper: Replacing America’s Aging Water Infrastructure
The following content is sponsored by the Copper Development Association
From Lead to Copper: Replacing America’s Aging Water Infrastructure
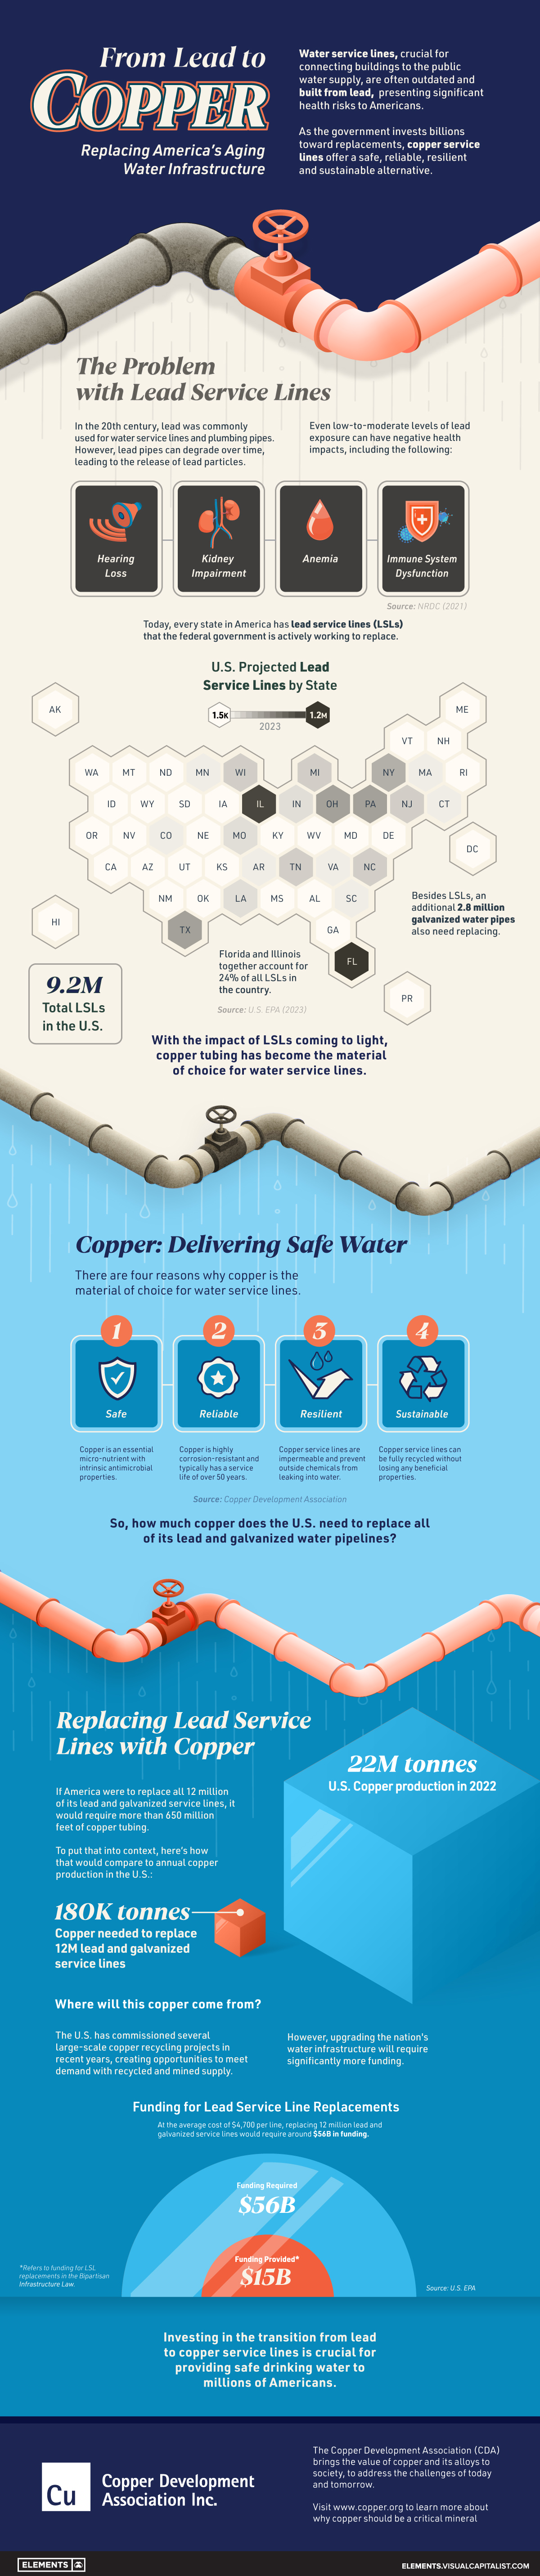
Water service lines, crucial for connecting buildings to the public water supply, are often outdated and built from lead, presenting significant health risks to Americans.
As the government invests billions toward replacing lead service lines, copper pipelines offer a safe, reliable, resilient, and sustainable alternative.
This infographic from the Copper Development Association illustrates how investing in the transition from lead to copper is crucial for providing safe water to millions of Americans.
The Problem with Lead Service Lines
In the 20th century, lead was commonly used for water service lines and plumbing pipes.
However, lead pipes can degrade over time, leading to the release of lead particles into drinking water. Even at low-to-moderate levels, lead exposure can have severe negative health impacts, including:
- Hearing loss
- Anemia
- Kidney impairment
- Immune system dysfunction
Today, every state in America has lead service lines (LSLs) that the federal government is actively working to replace.
Besides LSLs, an additional 2.8 million galvanized water pipes also need replacing.
Delivering Safe Water
Copper tubing has become the primary material to replace old water service lines.
The red metal is an antimicrobial material that kills pathogens, and it is also highly corrosion-resistant, with a typical service life of over 50 years.
In addition, copper service lines are impermeable and prevent outside chemicals from leaking into water. Copper tubes can be fully recycled at the end of their useful lives without losing any beneficial properties.
Replacing Lead Service Lines with Copper
If America were to replace all 12 million of its lead and galvanized service lines, it would require more than 650 million feet of copper tubing, equivalent to 180,000 tonnes of metal. To compare, the U.S. produced 22 million tonnes of copper in 2022.
The U.S. has commissioned several large-scale copper recycling projects in recent years, creating opportunities to meet the demand with recycled and mined supply.
However, upgrading the nation’s water infrastructure will require over $56 billion, way more than the $15 billion currently provided by the Bipartisan Infrastructure Law.
Visit Copper Development Association to learn more about how copper is crucial for providing safe water to millions of Americans.


Misc
Brass Rods: The Secure Choice
This graphic shows why brass rods are the secure choice for precision-machined and forged parts.

Brass Rods: The Secure Choice
The unique combination of machinability and recyclability makes brass rods the secure choice for manufacturers seeking future-proof raw material solutions.
This infographic, from the Copper Development Association, shows three ways brass rods give manufacturers greater control and a license to grow in the competitive market for precision-machined and forged products.
Future-Proof Investments in New Machine Tools
A material’s machinability directly impacts machine throughput, which typically has the largest impact on machine shop profitability.
The high-speed machining capabilities of brass rods maximize machine tool performance, allowing manufacturers to run the material faster and longer without sacrificing tool life, chip formation, or surface quality.
The high machining efficiency of brass leads to reduced per-part costs, quicker return on investment (ROI) for new machine tools, and expanded production capacity for new projects.
Supply Security Through Closed Loop Recycling
Brass, like its parent element copper, can be infinitely recycled.
In 2022, brass- and wire-rod mills accounted for the majority of the 830,000 tonnes of copper recycled from scrap in the U.S.
Given that scrap ratios for machined parts typically range from 60-70% by weight, producing mills benefit from a secure and steady supply of clean scrap returned directly from customers, which is recycled to create new brass rods.
The high residual value of brass scrap creates a strong recycling incentive. Scrap buy back programs give manufacturers greater control over raw material net costs as scrap value is often factored into supplier purchase agreements.
Next Generation Alloys for a Lead-Free Future
Increasingly stringent global regulations continue to pressure manufacturers to minimize the use of materials containing trace amounts of lead and other harmful impurities.
The latest generation of brass-rod alloys is engineered to meet the most demanding criteria for lead leaching in drinking water and other sensitive applications.
Seven brass-rod alloys passed rigorous testing to become the only ‘Acceptable Materials’ against lower lead leaching criteria recently adopted in the national U.S. drinking water quality standard, NSF 61.
Learn more about the advantages of brass rods solutions.
Misc
Brass Rods: The Safe Choice
From airbags to firefighting equipment, components made from brass rods play a vital role in creating a safer environment.

Brass Rods: The Safe Choice
From airbags to firefighting equipment, components made from brass rods play a vital role in creating a safer environment.
This infographic from the Copper Development Association illustrates three use cases for brass. This is the first of three infographics in our Choose Brass series.
Why Brass?
Brass is one of the most reliable metals for industrial and other applications. It contains little to no iron, protecting it from oxidation, which can cause other materials to fail over time.
Additionally, the malleability of brass ensures tight and leak-free metal-to-metal seals for threaded joints, minimizing the risk of costly and dangerous system failures. Brass’s durability ensures critical system components function properly for years.
Brass for Safe Water Systems
Exposure to lead in water can cause various health problems, including neurological damage, developmental delays, and cardiovascular diseases.
As a result, the U.S. sets minimum health-effect requirements for chemical contaminants and impurities indirectly transferred to drinking water from products, components, and materials used in water systems.
Currently, only brass rod alloys are designated as “acceptable materials” according to national standards.
Brass is also essential for ensuring workplace safety, particularly in high-risk manufacturing environments.
Using Brass for Safe Manufacturing and Industrial Environments
Brass is used extensively in industrial applications such as machinery components, valves, fittings, architectural elements, bearings, and gears.
The machinability of brass rods also means longer tool life and higher productivity for manufacturers of precision parts.
The microstructure of brass helps break up metal chips generated during machining operations, preventing long and stringy chips that can crash machines and seriously injure operators.
Additionally, brass’s non-sparking properties make it ideal for tooling, fittings, and components in high-risk industries such as oil & gas, chemicals, pharmaceuticals, paint manufacturing, power plants, and explosives.
Brass for Safer Communities
Many pieces of equipment in our daily lives also rely on brass rod parts to function. Control valves in gas stoves, BBQs, and home furnaces made from brass rods reduce the risk of deadly gas leaks and fires.
Moreover, brass is ideal for firefighting equipment due to its corrosion resistance, durability, heat resistance, and non-sparking properties.
Fittings made from brass rods ensure that the brakes and airbags in our vehicles work when needed.
Brass and other copper-based alloys are also naturally antimicrobial, helping prevent diseases when used in high-touch surfaces such as door handles.
These are only some of the ways that brass rods help build a safer world for everyone.
Explore the Advantages of Brass Rod Solutions.

-

 Electrification3 years ago
Ranked: The Top 10 EV Battery Manufacturers
-

 Electrification2 years ago
The Key Minerals in an EV Battery
-

 Real Assets3 years ago
The World’s Top 10 Gold Mining Companies
-

 Misc3 years ago
All the Metals We Mined in One Visualization
-

 Electrification3 years ago
The Biggest Mining Companies in the World in 2021
-

 Energy Shift2 years ago
What Are the Five Major Types of Renewable Energy?
-

 Electrification2 years ago
Mapped: Solar Power by Country in 2021
-

 Electrification2 years ago
The World’s Largest Nickel Mining Companies