

Misc
Mapped: U.S. Mineral Production Value by State in 2022
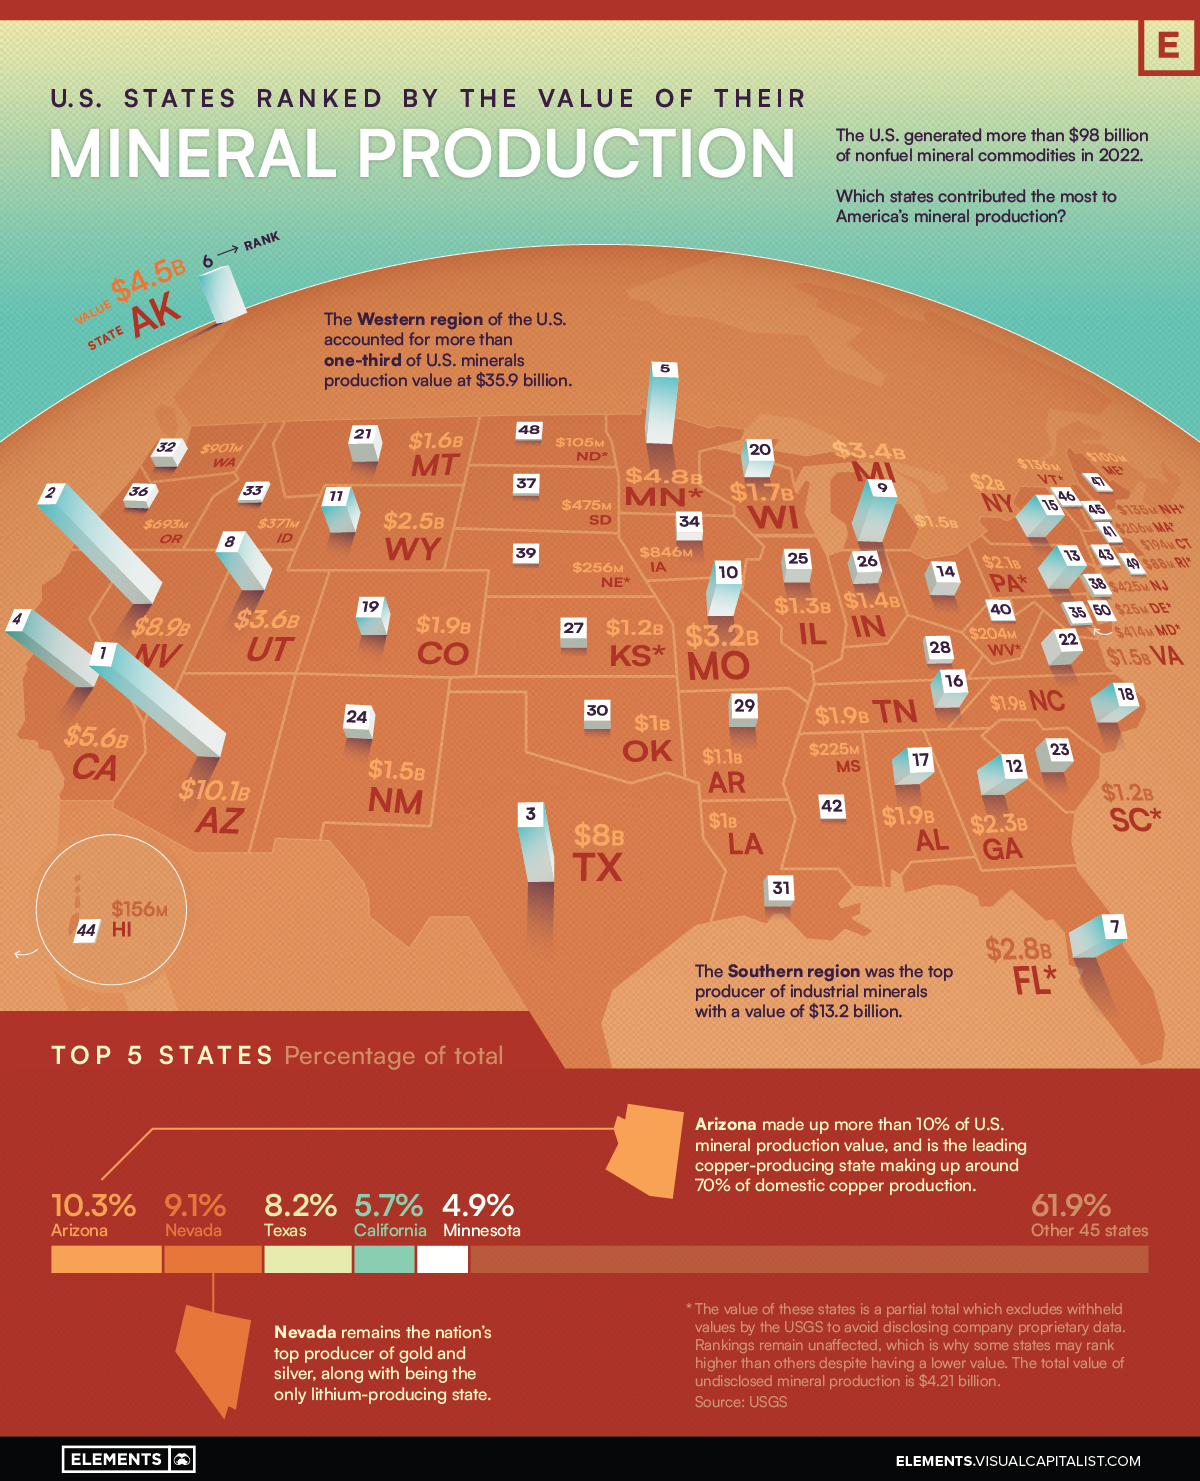
U.S. States Ranked by the Value of their Mineral Production
The U.S. produced $98.2 billion worth of nonfuel minerals in 2022, but which states made up the majority of the mining?
This map uses data from the USGS to map and rank U.S. states by the value of their nonfuel mineral production in 2022.
The ranking takes into account the mining of nonfuel minerals that are split into two main categories: metallic minerals (like gold, copper, or silver), and industrial minerals (like phosphate rock, various types of clay, and crushed stone).
The Top Mineral-Producing States in the U.S.
Arizona tops the list of mineral-producing states, with $10.1 billion worth of minerals which account for 10.3% of the U.S. total, largely due to the state’s prolific copper production. The state of Arizona accounted for around 70% of domestic copper production in 2022, and as a result also produces large amounts of molybdenum as a byproduct.
The state of Nevada was the next top mineral producer at $8.9 billion worth of minerals, thanks to its longstanding leadership in gold mining (accounting for 72% of U.S. gold production in 2022) and by having the only operating lithium project in America.
States in the Western region of the U.S. dominate the ranking of top mineral-producing states, holding the top two spots and making up half of the top 10 when it comes to total mineral production value.
| Rank | State | Mineral Production Value (2022) | Share of U.S. total |
|---|---|---|---|
| 1 | Arizona | $10.1B | 10.3% |
| 2 | Nevada | $8.9B | 9.1% |
| 3 | Texas | $8.0B | 8.2% |
| 4 | California | $5.6B | 5.7% |
| 5 | Minnesota* | $4.8B | 4.9% |
| 6 | Alaska | $4.5B | 4.6% |
| 7 | Florida* | $2.8B | 2.9% |
| 8 | Utah | $3.6B | 3.7% |
| 9 | Michigan | $3.4B | 3.4% |
| 10 | Missouri | $3.2B | 3.2% |
*The value of these states is a partial total which excludes withheld values by the USGS to avoid disclosing company proprietary data. Rankings remain unaffected which is why some states may rank higher than others despite having a lower value.
Texas rounds out the top three at $8 billion worth of minerals produced in 2022, largely thanks to its dominant production of crushed stone. The state of Texas was the top producer of crushed stone in 2022 at more than $2.8 billion worth, nearly double that of the next largest producer, Florida, which produced $1.5 billion worth.
What Minerals is the U.S. Producing the Most of?
Nonfuel mineral production is categorized into two main categories by the USGS, metals/metallic minerals and industrial minerals.
While not as shiny, the produced value of industrial minerals far outweighs that of metallic minerals. While $34.7 billion worth of metals were produced in 2022, industrial mineral production value was nearly double at $63.5 billion.
Construction aggregates like construction sand and gravel along with crushed stone made up almost half of industrial minerals production at $31.4 billion, with crushed stone being the leading mineral commodity overall at $21 billion of production value.
Following crushed stone, the next top minerals produced but the U.S. were (in decreasing order of value): cement, copper, construction sand and gravel, and gold.
Although the value of metals production decreased by 6% compared to 2021, industrial minerals production increased by 10% year-over-year, resulting in an overall increase in America’s overall nonfuel mineral production of 4%.


Misc
Brass Rods: The Secure Choice
This graphic shows why brass rods are the secure choice for precision-machined and forged parts.

Brass Rods: The Secure Choice
The unique combination of machinability and recyclability makes brass rods the secure choice for manufacturers seeking future-proof raw material solutions.
This infographic, from the Copper Development Association, shows three ways brass rods give manufacturers greater control and a license to grow in the competitive market for precision-machined and forged products.
Future-Proof Investments in New Machine Tools
A material’s machinability directly impacts machine throughput, which typically has the largest impact on machine shop profitability.
The high-speed machining capabilities of brass rods maximize machine tool performance, allowing manufacturers to run the material faster and longer without sacrificing tool life, chip formation, or surface quality.
The high machining efficiency of brass leads to reduced per-part costs, quicker return on investment (ROI) for new machine tools, and expanded production capacity for new projects.
Supply Security Through Closed Loop Recycling
Brass, like its parent element copper, can be infinitely recycled.
In 2022, brass- and wire-rod mills accounted for the majority of the 830,000 tonnes of copper recycled from scrap in the U.S.
Given that scrap ratios for machined parts typically range from 60-70% by weight, producing mills benefit from a secure and steady supply of clean scrap returned directly from customers, which is recycled to create new brass rods.
The high residual value of brass scrap creates a strong recycling incentive. Scrap buy back programs give manufacturers greater control over raw material net costs as scrap value is often factored into supplier purchase agreements.
Next Generation Alloys for a Lead-Free Future
Increasingly stringent global regulations continue to pressure manufacturers to minimize the use of materials containing trace amounts of lead and other harmful impurities.
The latest generation of brass-rod alloys is engineered to meet the most demanding criteria for lead leaching in drinking water and other sensitive applications.
Seven brass-rod alloys passed rigorous testing to become the only ‘Acceptable Materials’ against lower lead leaching criteria recently adopted in the national U.S. drinking water quality standard, NSF 61.
Learn more about the advantages of brass rods solutions.
Misc
Brass Rods: The Safe Choice
From airbags to firefighting equipment, components made from brass rods play a vital role in creating a safer environment.

Brass Rods: The Safe Choice
From airbags to firefighting equipment, components made from brass rods play a vital role in creating a safer environment.
This infographic from the Copper Development Association illustrates three use cases for brass. This is the first of three infographics in our Choose Brass series.
Why Brass?
Brass is one of the most reliable metals for industrial and other applications. It contains little to no iron, protecting it from oxidation, which can cause other materials to fail over time.
Additionally, the malleability of brass ensures tight and leak-free metal-to-metal seals for threaded joints, minimizing the risk of costly and dangerous system failures. Brass’s durability ensures critical system components function properly for years.
Brass for Safe Water Systems
Exposure to lead in water can cause various health problems, including neurological damage, developmental delays, and cardiovascular diseases.
As a result, the U.S. sets minimum health-effect requirements for chemical contaminants and impurities indirectly transferred to drinking water from products, components, and materials used in water systems.
Currently, only brass rod alloys are designated as “acceptable materials” according to national standards.
Brass is also essential for ensuring workplace safety, particularly in high-risk manufacturing environments.
Using Brass for Safe Manufacturing and Industrial Environments
Brass is used extensively in industrial applications such as machinery components, valves, fittings, architectural elements, bearings, and gears.
The machinability of brass rods also means longer tool life and higher productivity for manufacturers of precision parts.
The microstructure of brass helps break up metal chips generated during machining operations, preventing long and stringy chips that can crash machines and seriously injure operators.
Additionally, brass’s non-sparking properties make it ideal for tooling, fittings, and components in high-risk industries such as oil & gas, chemicals, pharmaceuticals, paint manufacturing, power plants, and explosives.
Brass for Safer Communities
Many pieces of equipment in our daily lives also rely on brass rod parts to function. Control valves in gas stoves, BBQs, and home furnaces made from brass rods reduce the risk of deadly gas leaks and fires.
Moreover, brass is ideal for firefighting equipment due to its corrosion resistance, durability, heat resistance, and non-sparking properties.
Fittings made from brass rods ensure that the brakes and airbags in our vehicles work when needed.
Brass and other copper-based alloys are also naturally antimicrobial, helping prevent diseases when used in high-touch surfaces such as door handles.
These are only some of the ways that brass rods help build a safer world for everyone.
Explore the Advantages of Brass Rod Solutions.

-

 Electrification3 years ago
Ranked: The Top 10 EV Battery Manufacturers
-

 Electrification2 years ago
The Key Minerals in an EV Battery
-

 Real Assets3 years ago
The World’s Top 10 Gold Mining Companies
-

 Misc3 years ago
All the Metals We Mined in One Visualization
-

 Electrification3 years ago
The Biggest Mining Companies in the World in 2021
-

 Energy Shift2 years ago
What Are the Five Major Types of Renewable Energy?
-

 Electrification2 years ago
The World’s Largest Nickel Mining Companies
-

 Electrification2 years ago
Mapped: Solar Power by Country in 2021