

Electrification
The Key Minerals in an EV Battery


Breaking Down the Key Minerals in an EV Battery
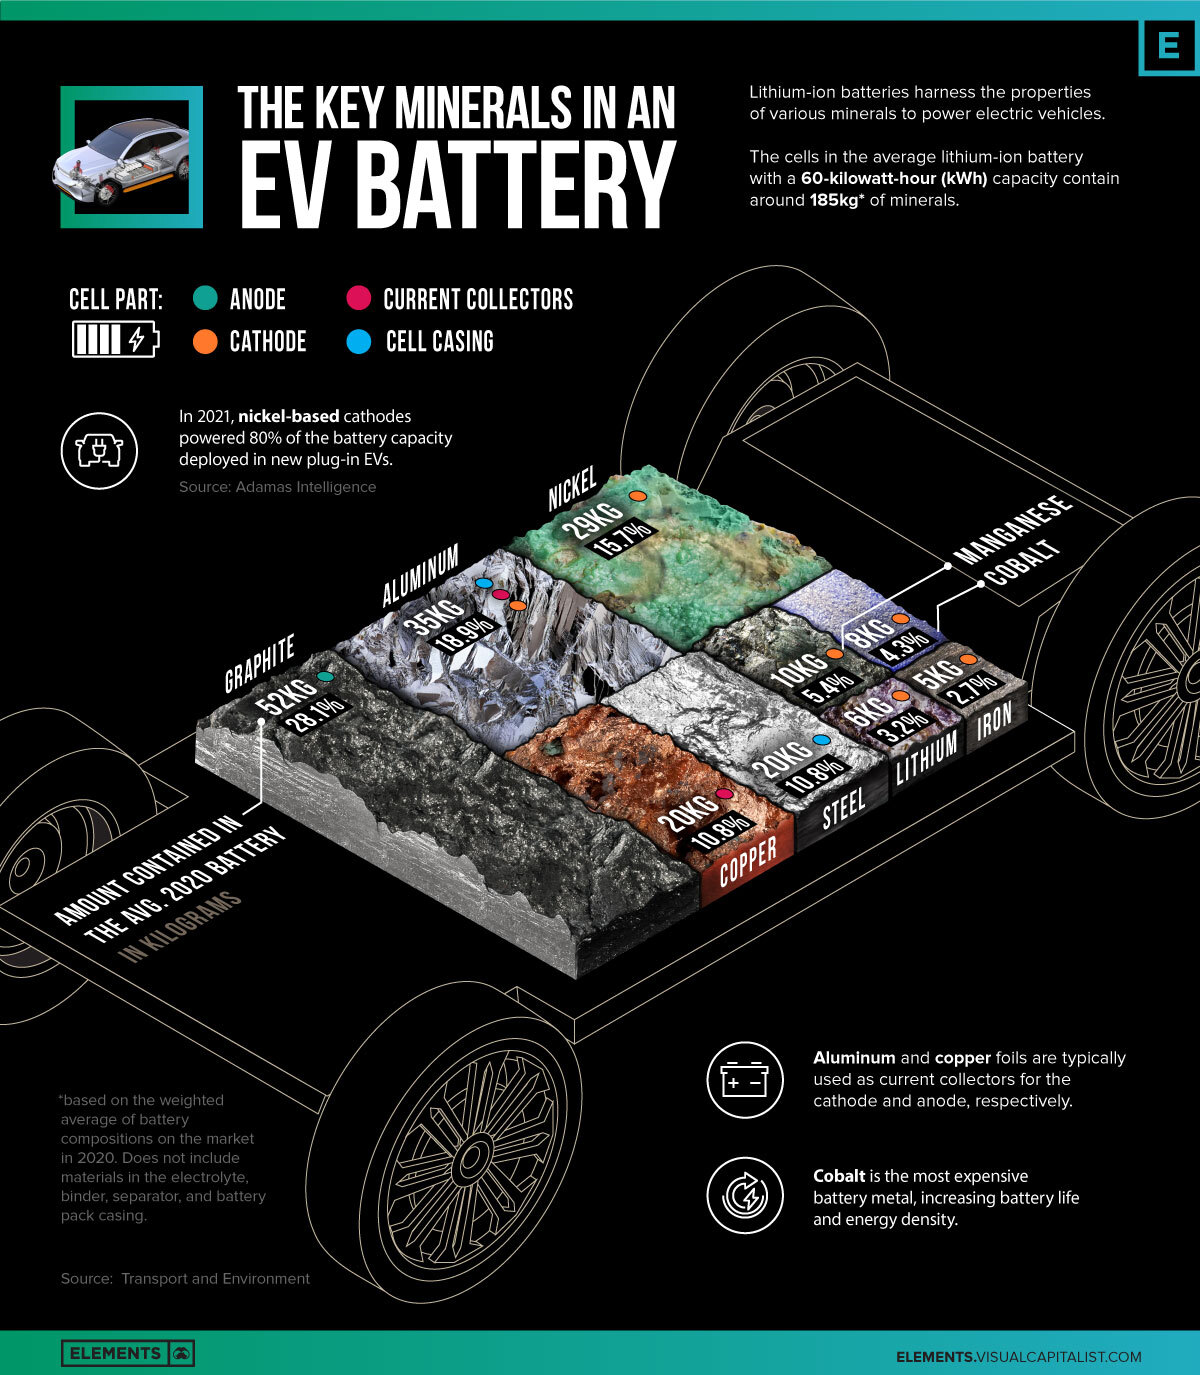
Inside practically every electric vehicle (EV) is a lithium-ion battery that depends on several key minerals that help power it.
Some minerals make up intricate parts within the cell to ensure the flow of electrical current. Others protect it from accidental damage on the outside.
This infographic uses data from the European Federation for Transport and Environment to break down the key minerals in an EV battery. The mineral content is based on the ‘average 2020 battery’, which refers to the weighted average of battery chemistries on the market in 2020.
The Battery Minerals Mix
The cells in the average battery with a 60 kilowatt-hour (kWh) capacity—the same size that’s used in a Chevy Bolt—contained roughly 185 kilograms of minerals. This figure excludes materials in the electrolyte, binder, separator, and battery pack casing.
| Mineral | Cell Part | Amount Contained in the Avg. 2020 Battery (kg) | % of Total |
|---|---|---|---|
| Graphite | Anode | 52kg | 28.1% |
| Aluminum | Cathode, Casing, Current collectors | 35kg | 18.9% |
| Nickel | Cathode | 29kg | 15.7% |
| Copper | Current collectors | 20kg | 10.8% |
| Steel | Casing | 20kg | 10.8% |
| Manganese | Cathode | 10kg | 5.4% |
| Cobalt | Cathode | 8kg | 4.3% |
| Lithium | Cathode | 6kg | 3.2% |
| Iron | Cathode | 5kg | 2.7% |
| Total | N/A | 185kg | 100% |
The cathode contains the widest variety of minerals and is arguably the most important and expensive component of the battery. The composition of the cathode is a major determinant in the performance of the battery, with each mineral offering a unique benefit.
For example, NMC batteries, which accounted for 72% of batteries used in EVs in 2020 (excluding China), have a cathode composed of nickel, manganese, and cobalt along with lithium. The higher nickel content in these batteries tends to increase their energy density or the amount of energy stored per unit of volume, increasing the driving range of the EV. Cobalt and manganese often act as stabilizers in NMC batteries, improving their safety.
Altogether, materials in the cathode account for 31.3% of the mineral weight in the average battery produced in 2020. This figure doesn’t include aluminum, which is used in nickel-cobalt-aluminum (NCA) cathode chemistries, but is also used elsewhere in the battery for casing and current collectors.
Meanwhile, graphite has been the go-to material for anodes due to its relatively low cost, abundance, and long cycle life. Since the entire anode is made up of graphite, it’s the single-largest mineral component of the battery. Other materials include steel in the casing that protects the cell from external damage, along with copper, used as the current collector for the anode.
Minerals Bonded by Chemistry
There are several types of lithium-ion batteries with different compositions of cathode minerals. Their names typically allude to their mineral breakdown.
For example:
- NMC811 batteries cathode composition:
80% nickel
10% manganese
10% cobalt - NMC523 batteries cathode composition:
50% nickel
20% manganese
30% cobalt
Here’s how the mineral contents differ for various battery chemistries with a 60kWh capacity:
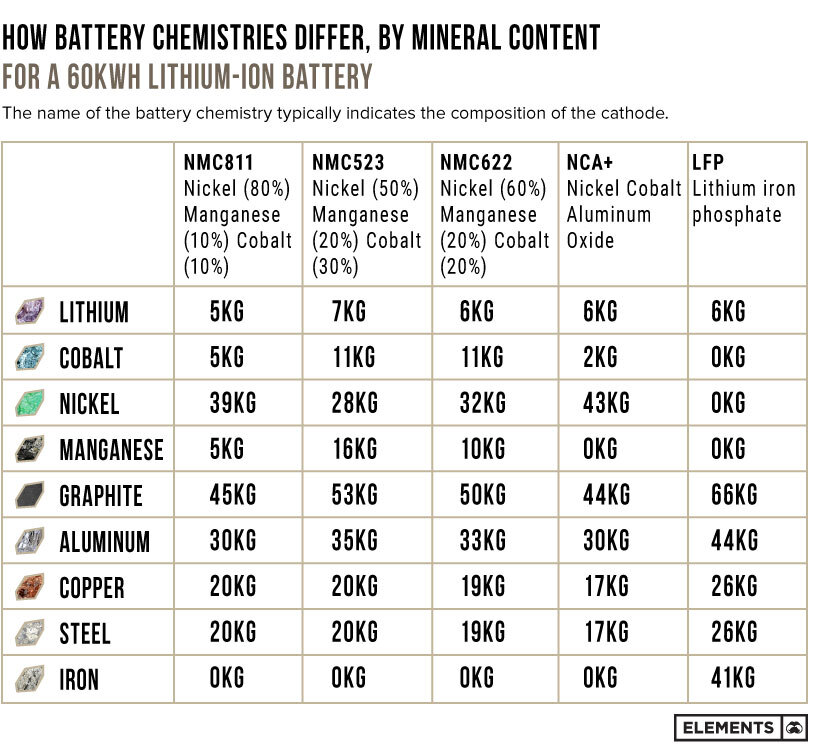
With consumers looking for higher-range EVs that do not need frequent recharging, nickel-rich cathodes have become commonplace. In fact, nickel-based chemistries accounted for 80% of the battery capacity deployed in new plug-in EVs in 2021.
Lithium iron phosphate (LFP) batteries do not use any nickel and typically offer lower energy densities at better value. Unlike nickel-based batteries that use lithium hydroxide compounds in the cathode, LFP batteries use lithium carbonate, which is a cheaper alternative. Tesla recently joined several Chinese automakers in using LFP cathodes for standard-range cars, driving the price of lithium carbonate to record highs.
The EV battery market is still in its early hours, with plenty of growth on the horizon. Battery chemistries are constantly evolving, and as automakers come up with new models with different characteristics, it’ll be interesting to see which new cathodes come around the block.


Electrification
White Gold: Mapping U.S. Lithium Mines
In this graphic, Visual Capitalist partnerered with EnergyX to explore the size and location of U.S. lithium mines.

White Gold: Mapping U.S. Lithium Mines
The U.S. doubled imports of lithium-ion batteries for the third consecutive year in 2022, and with EV demand growing yearly, U.S. lithium mines must ramp up production or rely on other nations for their supply of refined lithium.
To determine if the domestic U.S. lithium opportunity can meet demand, we partnered with EnergyX to determine how much lithium sits within U.S. borders.
U.S. Lithium Projects
The most crucial measure of a lithium mine’s potential is the quantity that can be extracted from the source.
For each lithium resource, the potential volume of lithium carbonate equivalent (LCE) was calculated with a ratio of one metric ton of lithium producing 5.32 metric tons of LCE. Cumulatively, existing U.S. lithium projects contain 94.8 million metric tons of LCE.
| Rank | Project Name | LCE, million metric tons (est.) |
|---|---|---|
| 1 | McDermitt Caldera | 21.5 |
| 2 | Thacker Pass | 19.1 |
| 3 | Tonopah Flats | 18.0 |
| 4 | TLC Lithium | 10.7 |
| 5 | Clayton Valley (Century Lithium) | 6.3 |
| 6 | Zeus Lithium | 6.3 |
| 7 | Rhyolite Ridge | 3.4 |
| 8 | Arkansas Smackover (Phase 1A) | 2.8 |
| 9 | Basin Project | 2.2 |
| 10 | McGee Deposit | 2.1 |
| 11 | Arkansas Smackover (South West) | 1.8 |
| 12 | Clayton Valley (Lithium-X, Pure Energy) | 0.8 |
| 13 | Big Sandy | 0.3 |
| 14 | Imperial Valley/Salton Sea | 0.3 |
U.S. Lithium Opportunities, By State
U.S. lithium projects mainly exist in western states, with comparatively minor opportunities in central or eastern states.
| State | LCE, million metric tons (est.) |
|---|---|
| Nevada | 88.2 |
| Arkansas | 4.6 |
| Arizona | 2.5 |
| California | 0.3 |
Currently, the U.S. is sitting on a wealth of lithium that it is underutilizing. For context, in 2022, the U.S. only produced about 5,000 metric tons of LCE and imported a projected 19,000 metric tons of LCE, showing that the demand for the mineral is healthy.
The Next Gold Rush?
U.S. lithium companies have the opportunity to become global leaders in lithium production and accelerate the transition to sustainable energy sources. This is particularly important as the demand for lithium is increasing every year.
EnergyX is on a mission to meet U.S. lithium demands using groundbreaking technology that can extract 300% more lithium from a source than traditional methods.
You can take advantage of this opportunity by investing in EnergyX and joining other significant players like GM in becoming a shareholder.

Electrification
Will Direct Lithium Extraction Disrupt the $90B Lithium Market?
Visual Capitalist and EnergyX explore how direct lithium extraction could disrupt the $90B lithium industry.
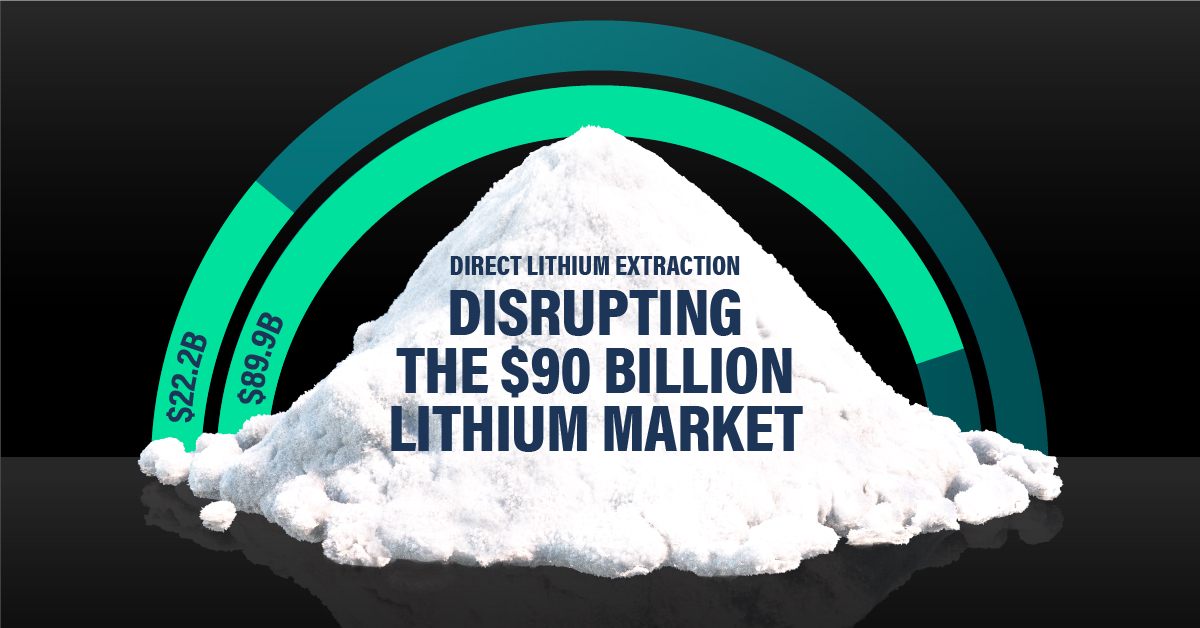
Will Direct Lithium Extraction Disrupt the $90B Lithium Market?
Current lithium extraction and refinement methods are outdated, often harmful to the environment, and ultimately inefficient. So much so that by 2030, lithium demand will outstrip supply by a projected 1.42 million metric tons. But there is a solution: Direct lithium extraction (DLE).
For this graphic, we partnered with EnergyX to try to understand how DLE could help meet global lithium demands and change an industry that is critical to the clean energy transition.
The Lithium Problem
Lithium is crucial to many renewable energy technologies because it is this element that allows EV batteries to react. In fact, it’s so important that projections show the lithium industry growing from $22.2B in 2023 to nearly $90B by 2030.
But even with this incredible growth, as you can see from the table, refined lithium production will need to increase 86.5% over and above current projections.
| 2022 (million metric tons) | 2030P (million metric tons) | |
|---|---|---|
| Lithium Carbonate Demand | 0.46 | 1.21 |
| Lithium Hydroxide Demand | 0.18 | 1.54 |
| Lithium Metal Demand | 0 | 0.22 |
| Lithium Mineral Demand | 0.07 | 0.09 |
| Total Demand | 0.71 | 3.06 |
| Total Supply | 0.75 | 1.64 |
The Solution: Direct Lithium Extraction
DLE is a process that uses a combination of solvent extraction, membranes, or adsorbents to extract and then refine lithium directly from its source. LiTASTM, the proprietary DLE technology developed by EnergyX, can recover an incredible 300% more lithium per ton than existing processes, making it the perfect tool to help meet lithium demands.
Additionally, LiTASTM can refine lithium at the lowest cost per unit volume directly from brine, an essential step in meeting tomorrow’s lithium demand and manufacturing next-generation batteries, while significantly reducing the footprint left by lithium mining.
| Hard Rock Mining | Underground Reservoirs | Direct Lithium Extraction | |
|---|---|---|---|
| Direct CO2 Emissions | 15,000 kg | 5,000 kg | 3.5 kg |
| Water Use | 170 m3 | 469 m3 | 34-94 m3 |
| Lithium Recovery Rate | 58% | 30-40% | 90% |
| Land Use | 464 m2 | 3124 m2 | 0.14 m2 |
| Process Time | Variable | 18 months | 1-2 days |
Providing the World with Lithium
DLE promises to disrupt the outdated lithium industry by improving lithium recovery rates and slashing emissions, helping the world meet the energy demands of tomorrow’s electric vehicles.
EnergyX is on a mission to become a worldwide leader in the sustainable energy transition using groundbreaking direct lithium extraction technology. Don’t miss your chance to join companies like GM and invest in EnergyX to transform the future of renewable energy.

-

 Electrification3 years ago
Ranked: The Top 10 EV Battery Manufacturers
-

 Real Assets2 years ago
The World’s Top 10 Gold Mining Companies
-

 Misc3 years ago
All the Metals We Mined in One Visualization
-

 Electrification3 years ago
The Biggest Mining Companies in the World in 2021
-

 Energy Shift2 years ago
What Are the Five Major Types of Renewable Energy?
-

 Electrification2 years ago
The World’s Largest Nickel Mining Companies
-

 Electrification2 years ago
Mapped: Solar Power by Country in 2021
-

 Electrification3 years ago
How Much Land is Needed to Power the U.S. with Solar?