

This graphic shows why brass rods are the secure choice for precision-machined and forged parts.


From airbags to firefighting equipment, components made from brass rods play a vital role in creating a safer environment.


Copper consumption for data centers in North America is estimated to jump from 197,000 tonnes in 2020 to 238,000 tonnes in 2030.
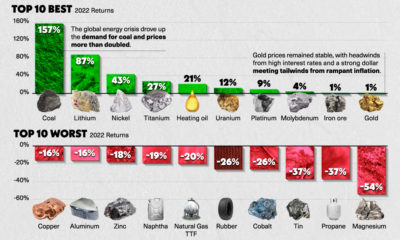

The year 2022 was full of volatility for commodity prices. This infographic charts the top 10 best and worst commodities by returns in 2022.
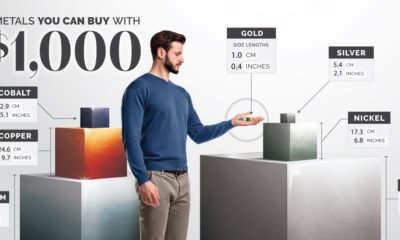

Curious how much of a metal you get for $1,000? This infographic compares the amount of precious and industrial metals worth $1,000.
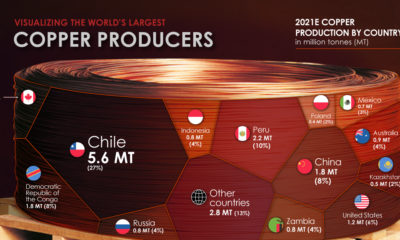

Many new technologies critical to the energy transition rely on copper. Here are the world's largest copper producers.
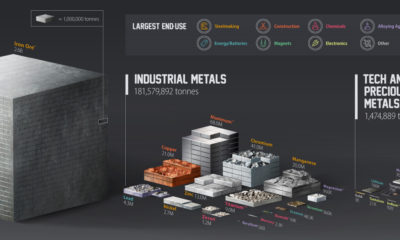

See the 2.8 billion tonnes of metals mined in 2021.
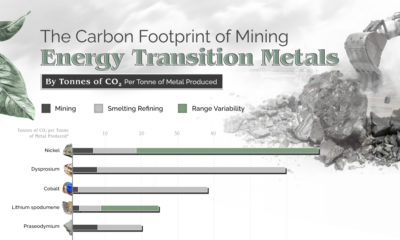

Metals are needed to build the clean energy transition's infrastructure, but how much carbon does mining and refining these metals emit?
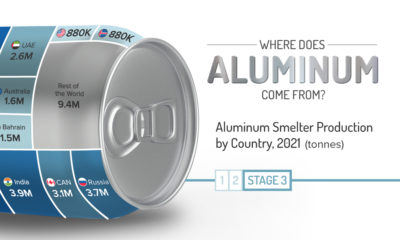

Aluminum is one of the world's most widely used metals, but producing it is a complex process. Here's a look at where it comes from.
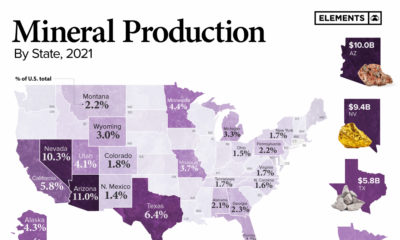

This infographic breaks down $90.4 billion in non-fuel mineral production by state.


