

Energy Shift
How Much Does the U.S. Depend on Russian Uranium?
![]() See this visualization first on the Voronoi app.
See this visualization first on the Voronoi app.
How Much Does the U.S. Depend on Russian Uranium?
This was originally posted on our Voronoi app. Download the app for free on iOS or Android and discover incredible data-driven charts from a variety of trusted sources.
The U.S. House of Representatives recently passed a ban on imports of Russian uranium. The bill must pass the Senate before becoming law.
In this graphic, we visualize how much the U.S. relies on Russian uranium, based on data from the United States Energy Information Administration (EIA).
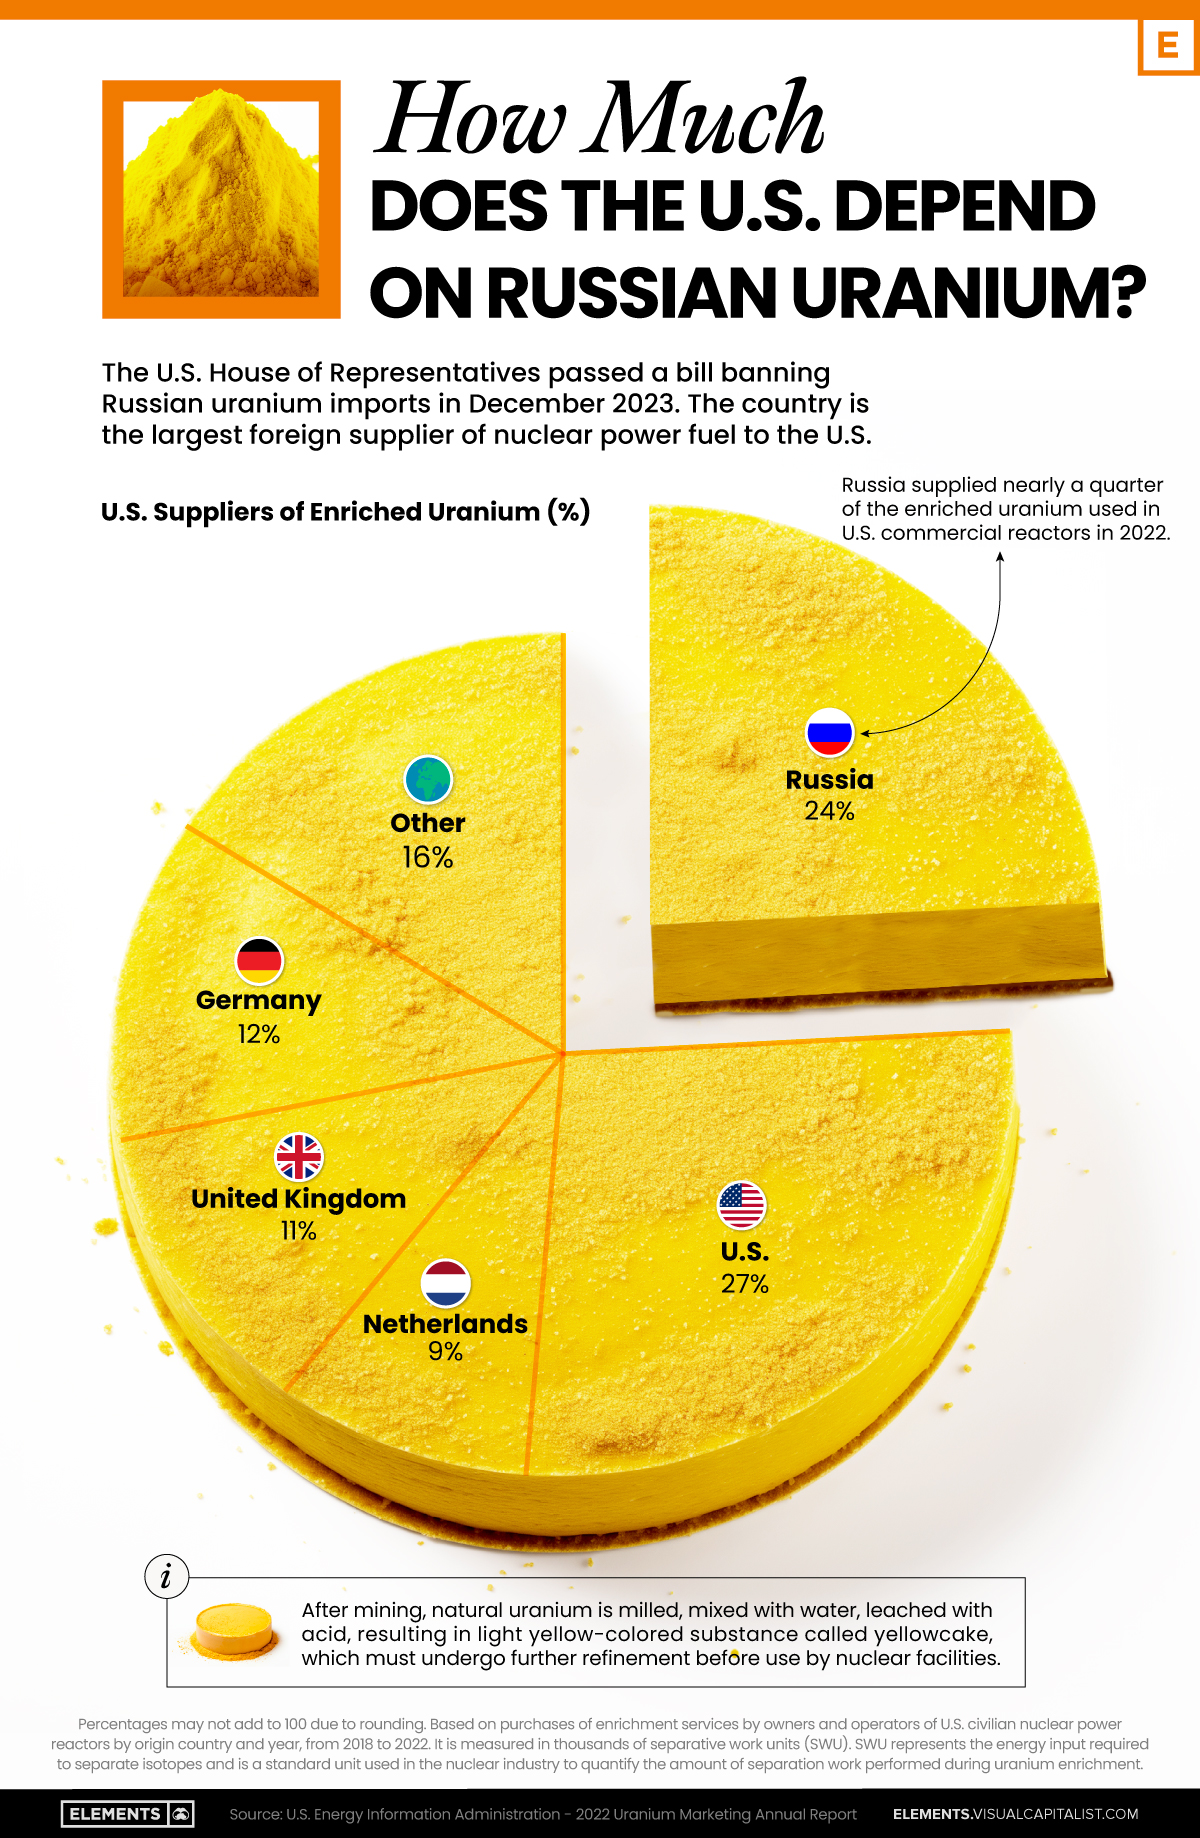
U.S. Suppliers of Enriched Uranium
After Russia invaded Ukraine, the U.S. imposed sanctions on Russian-produced oil and gas—yet Russian-enriched uranium is still being imported.
Currently, Russia is the largest foreign supplier of nuclear power fuel to the United States. In 2022, Russia supplied almost a quarter of the enriched uranium used to fuel America’s fleet of more than 90 commercial reactors.
| Country of enrichment service | SWU* | % |
|---|---|---|
| 🇺🇸 United States | 3,876 | 27.34% |
| 🇷🇺 Russia | 3,409 | 24.04% |
| 🇩🇪 Germany | 1,763 | 12.40% |
| 🇬🇧 United Kingdom | 1,593 | 11.23% |
| 🇳🇱 Netherlands | 1,303 | 9.20% |
| Other | 2,232 | 15.79% |
| Total | 14,176 | 100% |
SWU stands for “Separative Work Unit” in the uranium industry. It is a measure of the amount of work required to separate isotopes of uranium during the enrichment process. Source: U.S. Energy Information Administration
Most of the remaining uranium is imported from European countries, while another portion is produced by a British-Dutch-German consortium operating in the United States called Urenco.
Similarly, nearly a dozen countries around the world depend on Russia for more than half of their enriched uranium—and many of them are NATO-allied members and allies of Ukraine.
In 2023 alone, the U.S. nuclear industry paid over $800 million to Russia’s state-owned nuclear energy corporation, Rosatom, and its fuel subsidiaries.
It is important to note that 19% of electricity in the U.S. is powered by nuclear plants.
The dependency on Russian fuels dates back to the 1990s when the United States turned away from its own enrichment capabilities in favor of using down-blended stocks of Soviet-era weapons-grade uranium.
As part of the new uranium-ban bill, the Biden administration plans to allocate $2.2 billion for the expansion of uranium enrichment facilities in the United States.


Energy Shift
The World’s Biggest Oil Producers in 2023
Just three countries accounted for 40% of global oil production last year.

The World’s Biggest Oil Producers in 2023
This was originally posted on our Voronoi app. Download the app for free on iOS or Android and discover incredible data-driven charts from a variety of trusted sources.
Despite efforts to decarbonize the global economy, oil still remains one of the world’s most important resources. It’s also produced by a fairly limited group of countries, which can be a source of economic and political leverage.
This graphic illustrates global crude oil production in 2023, measured in million barrels per day, sourced from the U.S. Energy Information Administration (EIA).
Three Countries Account for 40% of Global Oil Production
In 2023, the United States, Russia, and Saudi Arabia collectively contributed 32.7 million barrels per day to global oil production.
| Oil Production 2023 | Million barrels per day |
|---|---|
| 🇺🇸 U.S. | 12.9 |
| 🇷🇺 Russia | 10.1 |
| 🇸🇦 Saudi Arabia | 9.7 |
| 🇨🇦 Canada | 4.6 |
| 🇮🇶 Iraq | 4.3 |
| 🇨🇳 China | 4.2 |
| 🇮🇷 Iran | 3.6 |
| 🇧🇷 Brazil | 3.4 |
| 🇦🇪 UAE | 3.4 |
| 🇰🇼 Kuwait | 2.7 |
| 🌍 Other | 22.8 |
These three nations have consistently dominated oil production since 1971. The leading position, however, has alternated among them over the past five decades.
In contrast, the combined production of the next three largest producers—Canada, Iraq, and China—reached 13.1 million barrels per day in 2023, just surpassing the production of the United States alone.
In the near term, no country is likely to surpass the record production achieved by the U.S. in 2023, as no other producer has ever reached a daily capacity of 13.0 million barrels. Recently, Saudi Arabia’s state-owned Saudi Aramco scrapped plans to increase production capacity to 13.0 million barrels per day by 2027.
In 2024, analysts forecast that the U.S. will maintain its position as the top oil producer. In fact, according to Macquarie Group, U.S. oil production is expected to achieve a record pace of about 14 million barrels per day by the end of the year.
Energy Shift
Visualizing the Rise of the U.S. as Top Crude Oil Producer
Over the last decade, the U.S. has surpassed Saudi Arabia and Russia as the world’s top producer of crude oil.
Visualizing the Rise of the U.S. as Top Crude Oil Producer
Over the last decade, the United States has established itself as the world’s top producer of crude oil, surpassing Saudi Arabia and Russia.
This infographic illustrates the rise of the U.S. as the biggest oil producer, based on data from the U.S. Energy Information Administration (EIA).
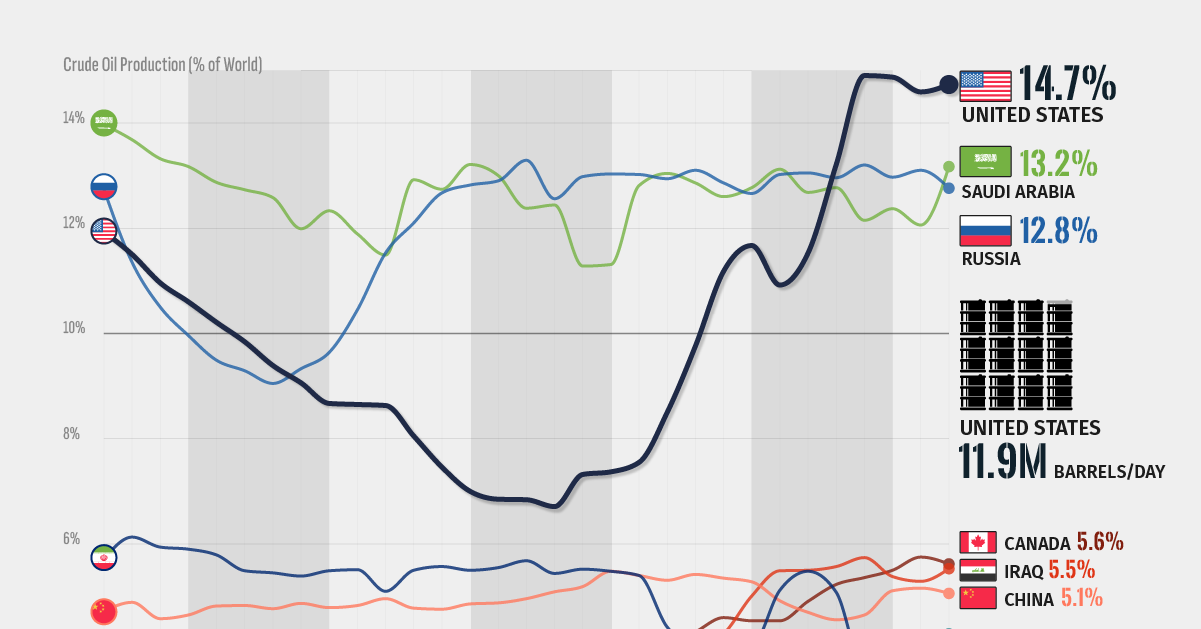
U.S. Takes Lead in 2018
Over the last three decades, the United States, Saudi Arabia, and Russia have alternated as the top crude producers, but always by small margins.
During the 1990s, Saudi Arabia dominated crude production, taking advantage of its extensive oil reserves. The petroleum sector accounts for roughly 42% of the country’s GDP, 87% of its budget revenues, and 90% of export earnings.
However, during the 2000s, Russia surpassed Saudi Arabia in production during some years, following strategic investments in expanding its oil infrastructure. The majority of Russia’s oil goes to OECD Europe (60%), with around 20% going to China.
| Crude Oil Production | United States | Saudi Arabia | Russia |
|---|---|---|---|
| 1992 | 11.93% | 13.97% | 12.74% |
| 1993 | 11.50% | 13.68% | 11.35% |
| 1994 | 10.96% | 13.32% | 10.50% |
| 1995 | 10.60% | 13.17% | 9.96% |
| 1996 | 10.21% | 12.87% | 9.49% |
| 1997 | 9.84% | 12.73% | 9.29% |
| 1998 | 9.39% | 12.58% | 9.05% |
| 1999 | 9.06% | 11.99% | 9.33% |
| 2000 | 8.67% | 12.33% | 9.64% |
| 2001 | 8.65% | 11.89% | 10.45% |
| 2002 | 8.63% | 11.49% | 11.53% |
| 2003 | 8.05% | 12.92% | 12.10% |
| 2004 | 7.46% | 12.74% | 12.67% |
| 2005 | 7.00% | 13.21% | 12.82% |
| 2006 | 6.85% | 13.00% | 12.90% |
| 2007 | 6.84% | 12.38% | 13.29% |
| 2008 | 6.71% | 12.44% | 12.56% |
| 2009 | 7.32% | 11.28% | 12.98% |
| 2010 | 7.37% | 11.31% | 13.03% |
| 2011 | 7.55% | 12.81% | 13.02% |
| 2012 | 8.50% | 13.04% | 12.94% |
| 2013 | 9.76% | 12.86% | 13.10% |
| 2014 | 11.18% | 12.60% | 12.86% |
| 2015 | 11.67% | 12.77% | 12.66% |
| 2016 | 10.92% | 13.12% | 13.02% |
| 2017 | 11.53% | 12.68% | 13.05% |
| 2018 | 13.21% | 12.77% | 12.96% |
| 2019 | 14.90% | 12.15% | 13.20% |
| 2020 | 14.87% | 12.37% | 12.97% |
| 2021 | 14.59% | 12.06% | 13.10% |
| 2022 | 14.73% | 13.17% | 12.76% |
Over the 2010s, the U.S. witnessed an increase in domestic production, much of it attributable to hydraulic fracturing, or “fracking,” in the shale formations ranging from Texas to North Dakota. It became the world’s largest oil producer in 2018, outproducing Russia and Saudi Arabia.
The U.S. accounted for 14.7% of crude oil production worldwide in 2022, compared to 13.1% for Saudi Arabia and 12.7% for Russia.
Despite leading petroleum production, the U.S. still trails seven countries in remaining proven reserves underground, with 55,251 million barrels.
Venezuela has the biggest reserves with 303,221 million barrels. Saudi Arabia, with 267,192 million barrels, occupies the second spot, while Russia is seventh with 80,000 million barrels.

-

 Electrification3 years ago
Ranked: The Top 10 EV Battery Manufacturers
-

 Electrification2 years ago
The Key Minerals in an EV Battery
-

 Real Assets3 years ago
The World’s Top 10 Gold Mining Companies
-

 Misc3 years ago
All the Metals We Mined in One Visualization
-

 Electrification3 years ago
The Biggest Mining Companies in the World in 2021
-

 Energy Shift2 years ago
What Are the Five Major Types of Renewable Energy?
-

 Electrification2 years ago
Mapped: Solar Power by Country in 2021
-

 Electrification2 years ago
The World’s Largest Nickel Mining Companies