

Real Assets
200 Years of Global Gold Production, by Country
Click on the image to view the high-resolution version.


Visualizing Global Gold Production Over 200 Years
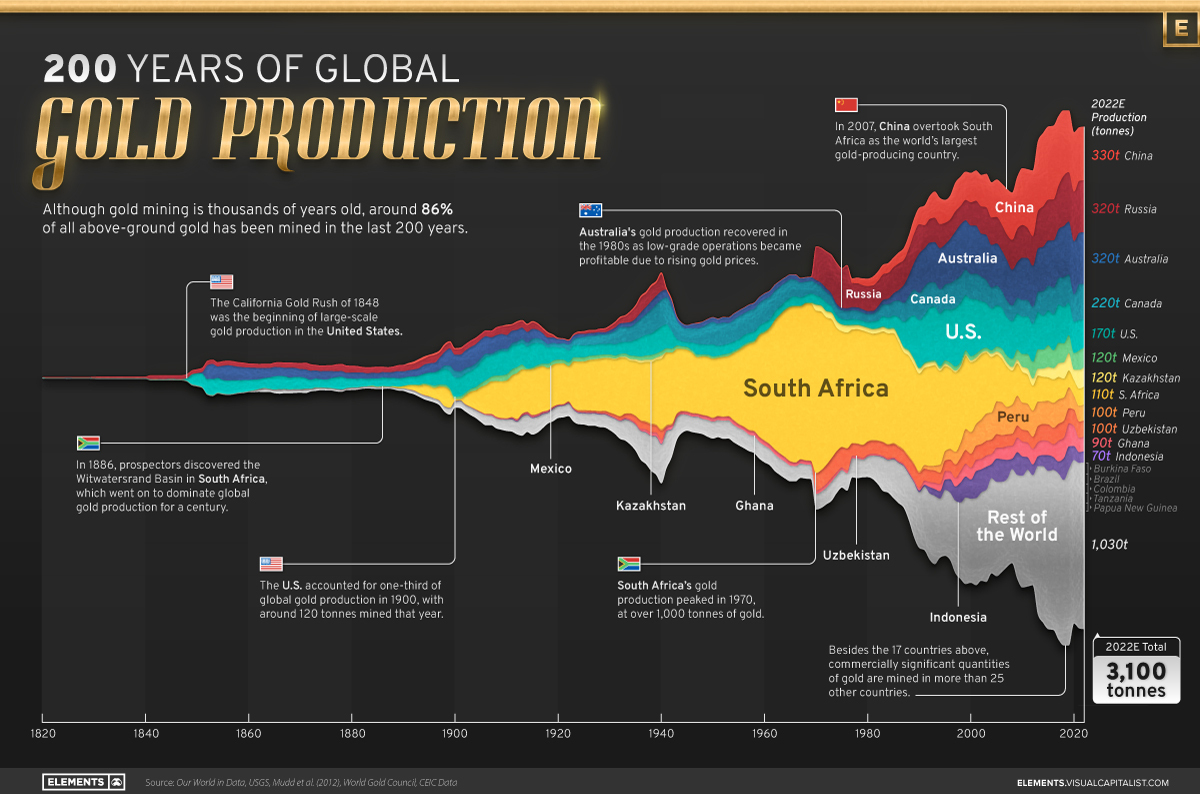
Although the practice of gold mining has been around for thousands of years, it’s estimated that roughly 86% of all above-ground gold was extracted in the last 200 years.
With modern mining techniques making large-scale production possible, global gold production has grown exponentially since the 1800s.
The above infographic uses data from Our World in Data to visualize global gold production by country from 1820 to 2022, showing how gold mining has evolved to become increasingly global over time.
A Brief History of Gold Mining
The best-known gold rush in modern history occurred in California in 1848, when James Marshall discovered gold in Sacramento Valley. As word spread, thousands of migrants flocked to California in search of gold, and by 1855, miners had extracted around $2 billion worth of gold.
The United States, Australia, and Russia were (interchangeably) the three largest gold producers until the 1890s. Then, South Africa took the helm thanks to the massive discovery in the Witwatersrand Basin, now regarded today as one of the world’s greatest ever goldfields.
South Africa’s annual gold production peaked in 1970 at 1,002 tonnes—by far the largest amount of gold produced by any country in a year.
With the price of gold rising since the 1980s, global gold production has become increasingly widespread. By 2007, China was the world’s largest gold-producing nation, and today a significant quantity of gold is being mined in over 40 countries.
The Top Gold-Producing Countries in 2022
Around 31% of the world’s gold production in 2022 came from three countries—China, Russia, and Australia, with each producing over 300 tonnes of the precious metal.
| Rank | Country | 2022E Gold Production, tonnes | % of Total |
|---|---|---|---|
| #1 | 🇨🇳 China | 330 | 11% |
| #2 | 🇷🇺 Russia | 320 | 10% |
| #3 | 🇦🇺 Australia | 320 | 10% |
| #4 | 🇨🇦 Canada | 220 | 7% |
| #5 | 🇺🇸 United States | 170 | 5% |
| #6 | 🇲🇽 Mexico | 120 | 4% |
| #7 | 🇰🇿 Kazakhstan | 120 | 4% |
| #8 | 🇿🇦 South Africa | 110 | 4% |
| #9 | 🇵🇪 Peru | 100 | 3% |
| #10 | 🇺🇿 Uzbekistan | 100 | 3% |
| #11 | 🇬🇭 Ghana | 90 | 3% |
| #12 | 🇮🇩 Indonesia | 70 | 2% |
| - | 🌍 Rest of the World | 1,030 | 33% |
| - | World Total | 3,100 | 100% |
North American countries Canada, the U.S., and Mexico round out the top six gold producers, collectively making up 16% of the global total. The state of Nevada alone accounted for 72% of U.S. production, hosting the world’s largest gold mining complex (including six mines) owned by Nevada Gold Mines.
Meanwhile, South Africa produced 110 tonnes of gold in 2022, down by 74% relative to its output of 430 tonnes in 2000. This long-term decline is the result of mine closures, maturing assets, and industrial conflict, according to the World Gold Council.
Interestingly, two smaller gold producers on the list, Uzbekistan and Indonesia, host the second and third-largest gold mining operations in the world, respectively.
The Outlook for Global Gold Production
As of April 25, gold prices were hovering around the $2,000 per ounce mark and nearing all-time highs. For mining companies, higher gold prices can mean more profits per ounce if costs remain unaffected.
According to the World Gold Council, mined gold production is expected to increase in 2023 and could surpass the record set in 2018 (3,300 tonnes), led by the expansion of existing projects in North America. The chances of record mine output could be higher if gold prices continue to increase.


Real Assets
Charted: The Value Gap Between the Gold Price and Gold Miners
While gold prices hit all-time highs, gold mining stocks have lagged far behind.

Gold Price vs. Gold Mining Stocks
This was originally posted on our Voronoi app. Download the app for free on Apple or Android and discover incredible data-driven charts from a variety of trusted sources.
Although the price of gold has reached new record highs in 2024, gold miners are still far from their 2011 peaks.
In this graphic, we illustrate the evolution of gold prices since 2000 compared to the NYSE Arca Gold BUGS Index (HUI), which consists of the largest and most widely held public gold production companies. The data was compiled by Incrementum AG.
Mining Stocks Lag Far Behind
In April 2024, gold reached a new record high as Federal Reserve Chair Jerome Powell signaled policymakers may delay interest rate cuts until clearer signs of declining inflation materialize.
Additionally, with elections occurring in more than 60 countries in 2024 and ongoing conflicts in Ukraine and Gaza, central banks are continuing to buy gold to strengthen their reserves, creating momentum for the metal.
Traditionally known as a hedge against inflation and a safe haven during times of political and economic uncertainty, gold has climbed over 11% so far this year.
According to Business Insider, gold miners experienced their best performance in a year in March 2024. During that month, the gold mining sector outperformed all other U.S. industries, surpassing even the performance of semiconductor stocks.
Still, physical gold has outperformed shares of gold-mining companies over the past three years by one of the largest margins in decades.
| Year | Gold Price | NYSE Arca Gold BUGS Index (HUI) |
|---|---|---|
| 2023 | $2,062.92 | $243.31 |
| 2022 | $1,824.32 | $229.75 |
| 2021 | $1,828.60 | $258.87 |
| 2020 | $1,895.10 | $299.64 |
| 2019 | $1,523.00 | $241.94 |
| 2018 | $1,281.65 | $160.58 |
| 2017 | $1,296.50 | $192.31 |
| 2016 | $1,151.70 | $182.31 |
| 2015 | $1,060.20 | $111.18 |
| 2014 | $1,199.25 | $164.03 |
| 2013 | $1,201.50 | $197.70 |
| 2012 | $1,664.00 | $444.22 |
| 2011 | $1,574.50 | $498.73 |
| 2010 | $1,410.25 | $573.32 |
| 2009 | $1,104.00 | $429.91 |
| 2008 | $865.00 | $302.41 |
| 2007 | $836.50 | $409.37 |
| 2006 | $635.70 | $338.24 |
| 2005 | $513.00 | $276.90 |
| 2004 | $438.00 | $215.33 |
| 2003 | $417.25 | $242.93 |
| 2002 | $342.75 | $145.12 |
| 2001 | $276.50 | $65.20 |
| 2000 | $272.65 | $40.97 |
Among the largest companies on the NYSE Arca Gold BUGS Index, Colorado-based Newmont has experienced a 24% drop in its share price over the past year. Similarly, Canadian Barrick Gold also saw a decline of 6.5% over the past 12 months.
Real Assets
All the Metals We Mined in One Visualization
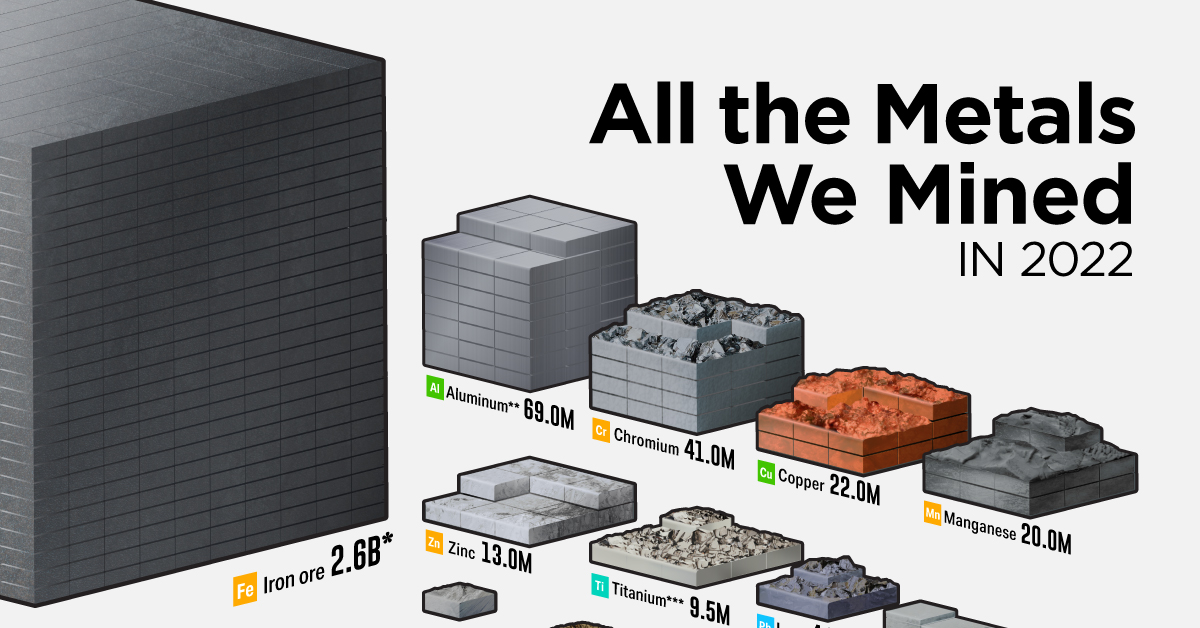
This infographic visualizes the 2.8 billion tonnes of metals mined in 2022.
All the Metals We Mined in One Visualization
Metals are a big part of our daily lives, found in every building we enter and all devices we use.
Today, major industries that directly consume processed mineral materials contribute 14% of the United States economy.
The above infographic visualizes all 2.8 billion tonnes of metals mined in 2022 and highlights each metal’s largest end-use using data from the United States Geological Survey (USGS).
Iron Ore Dominance
Iron ore dominates the metals mining landscape, comprising 93% of the total mined. In 2022, 2.6 billion tonnes of iron ore were mined, containing about 1.6 billion tonnes of iron.
| Metal/Ore | Quantity Mined in 2022 (tonnes) | % of Total |
|---|---|---|
| Iron ore | 2,600,000,000 | 93.3% |
| Industrial metals | 185,111,835 | 6.6% |
| Technology and Precious Metals | 1,500,008 | 0.05% |
| Total | 2,786,611,843 | 100% |
Percentages may not add up to 100 due to rounding.
Iron ores are found in various geologic environments, such as igneous, metamorphic, or sedimentary rocks, and can contain over 70% iron, with many falling in the 50-60% range.
Combined with other materials like coke and limestone, iron ore is primarily used in steel production. Today, almost all (98%) iron ore is dedicated to steelmaking.
The ore is typically mined in about 50 countries, but Australia, Brazil, China, and India are responsible for 75% of the production.
Because of its essential role in infrastructure development, iron ore is one of the most crucial materials underpinning urbanization and economic growth.
Industrial Metals
Industrial metals occupy the second position on our list, constituting 6.6% of all metals mined in 2022. These metals, including copper, aluminum, lead, and zinc, are employed in construction and industrial applications.
Aluminum constituted nearly 40% of industrial metal production in 2022. China was responsible for 56% of all aluminum produced.
| Industrial Metals | 2022 Mine Production (tonnes) | % of Total |
|---|---|---|
| Aluminum | 69,000,000 | 37.3% |
| Chromium | 41,000,000 | 22.1% |
| Copper | 22,000,000 | 11.9% |
| Manganese | 20,000,000 | 10.8% |
| Zinc | 13,000,000 | 7.0% |
| Titanium (mineral concentrates) | 9,500,000 | 5.1% |
| Lead | 4,500,000 | 2.4% |
| Nickel | 3,300,000 | 1.8% |
| Zirconium Minerals (Zircon) | 1,400,000 | 0.8% |
| Magnesium | 1,000,000 | 0.5% |
| Strontium | 340,000 | 0.2% |
| Uranium | 49,355 | 0.03% |
| Bismuth | 20,000 | 0.01% |
| Mercury | 2,200 | 0.00% |
| Beryllium | 280 | 0.00% |
| Total | 185,111,835 | 100% |
In the second position is chromium, which plays a primary role in rendering stainless steel corrosion-resistant. South Africa led chromium production, accounting for 44% of the total mined last year.
Technology and Precious Metals
Despite representing less than 1% of all the metals mined, technology metals have been on the news over the last few years as countries and companies seek these materials to reduce carbon emissions and improve productivity.
| Technology and Precious Metals | 2022 Mine Production (tonnes) | % of Total |
|---|---|---|
| Tin | 310,000 | 20.7% |
| Rare Earth Oxides | 300,000 | 20.0% |
| Molybdenum | 250,000 | 16.7% |
| Cobalt | 190,000 | 12.7% |
| Lithium | 130,000 | 8.7% |
| Vanadium | 100,000 | 6.7% |
| Tungsten | 84,000 | 5.6% |
| Niobium | 79,000 | 5.3% |
| Silver | 26,000 | 1.7% |
| Cadmium | 24,000 | 1.6% |
| Gold | 3,100 | 0.2% |
| Tantalum | 2,000 | 0.1% |
| Indium | 900 | 0.1% |
| Gallium | 550 | 0.04% |
| Platinum Group Metals | 400 | 0.03% |
| Rhenium | 58 | 0.004% |
| Total | 1,500,008 | 100% |
They include lithium and cobalt, used in electric vehicles and battery storage, and rare earths, used in magnets, metal alloys, and electronics. Many of them are considered critical for countries’ security due to their role in clean energy technologies and dependency on other nations to supply domestic demand.
However, despite increasing interest in these metals, they are still behind precious metals such as gold and silver regarding market size.
The gold market, for example, reached $196 billion in 2022, compared to $10.6 billion for the rare earths market.

-

 Electrification3 years ago
Ranked: The Top 10 EV Battery Manufacturers
-

 Electrification2 years ago
The Key Minerals in an EV Battery
-

 Real Assets3 years ago
The World’s Top 10 Gold Mining Companies
-

 Misc3 years ago
All the Metals We Mined in One Visualization
-

 Electrification3 years ago
The Biggest Mining Companies in the World in 2021
-

 Energy Shift2 years ago
What Are the Five Major Types of Renewable Energy?
-

 Electrification2 years ago
Mapped: Solar Power by Country in 2021
-

 Electrification2 years ago
The World’s Largest Nickel Mining Companies