

Energy Shift
China Dominates the Supply of U.S. Critical Minerals List
![]() See this visualization first on the Voronoi app.
See this visualization first on the Voronoi app.
China Dominates the Supply of U.S. Critical Minerals List
This was originally posted on our Voronoi app. Download the app for free on iOS or Android and discover incredible data-driven charts from a variety of trusted sources.
Most countries have, for many decades, kept a record of their own critical minerals list.
For example, the U.S., drew up a list of “war minerals” during World War I, containing important minerals which could not be found and produced in abundance domestically. They included: tin, nickel, platinum, nitrates and potash.
Since then, as the economy has grown and innovated, critical mineral lists have expanded considerably. The Energy Act of 2020 defines a critical mineral as:
“A non-fuel mineral or mineral material essential to the economic or national security of the U.S., whose supply chains are vulnerable to disruption.” — Energy Act, 2020.
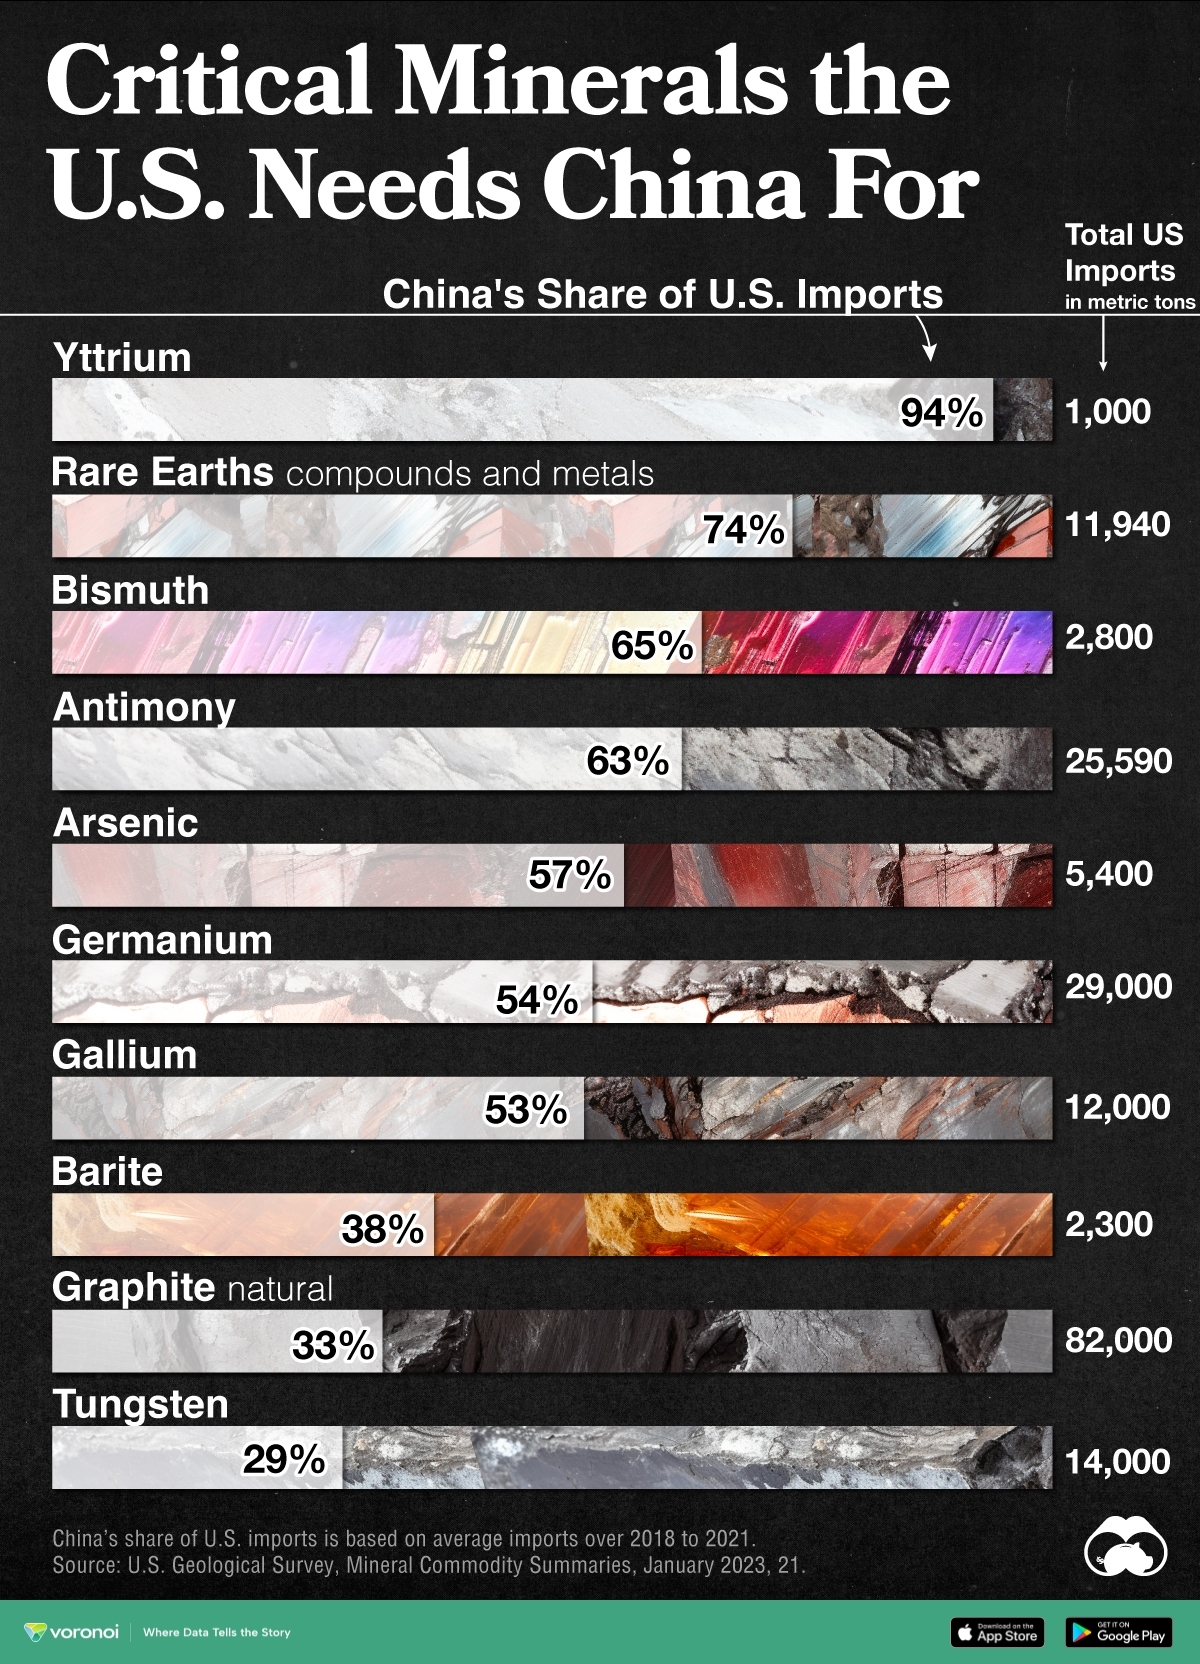
Currently there are 50 entries on this list and the U.S. Geological Survey (USGS) estimates that China is the leading producer for 30 of them. From USGS data, we visualize China’s share of U.S. imports for 10 critical minerals.
What Key Critical Minerals Does the U.S. Import From China?
The U.S. is 100% import-reliant for its supply of yttrium, with China responsible for 94% of U.S. imports of the metal from 2018 to 2021.
A soft silvery metal, yttrium is used as an additive for alloys, making microwave filters for radars, and as a catalyst in ethylene polymerization—a key process in making certain kinds of plastic.
China is a major supplier of the following listed critical minerals to the U.S.
| Critical Mineral | China's Share of U.S. Imports | U.S. Imports (Tonnes) | Uses |
|---|---|---|---|
| Yttrium | 94% | 1,000 | Catalyst, Microwave filters |
| Rare Earths | 74% | 11,940 | Smartphones, Cameras |
| Bismuth | 65% | 2,800 | Metallurgy |
| Antimony | 63% | 25,590 | Batteries |
| Arsenic | 57% | 5,400 | Semiconductors |
| Germanium | 54% | 29,000 | Chips, Fiber optics |
| Gallium | 53% | 12,000 | Chips, Fiber optics |
| Barite | 38% | 2,300 | Hydrocarbon production |
| Graphite (natural) | 33% | 82,000 | Batteries, Lubricants |
| Tungsten | 29% | 14,000 | Metallurgy |
Note: China’s share of U.S. critical minerals imports is based on average imports from 2018 to 2021.
Meanwhile, the U.S. also imports nearly three-quarters of its rare earth compounds and metals demand from China. Rare earth elements—so called since they are not found in easily-mined, concentrated clusters—are a collection of 15 elements on the periodic table, known as the lanthanide series.
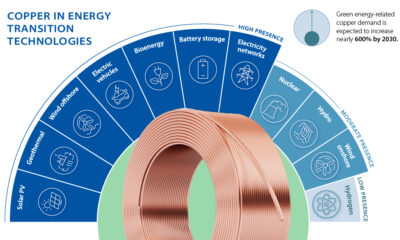
Rare earths are used in smartphones, cameras, hard disks, and LEDs but also, crucially, in the clean energy and defense industries.
Does China’s Dominance of U.S. Critical Minerals Supply Matter?
The USGS estimates that China could potentially disrupt the global rare earth oxide supply by cutting off 40–50% production, impacting suppliers of advanced components used in U.S. defense systems.
A version of this sort of trade warfare is already playing out. Earlier this year, China implemented export controls on germanium and gallium. The U.S. relies on China for around 54% of its demand for both minerals, used for producing chips, solar panels, and fiber optics.
China’s controls were seen as a retaliation against the U.S. which has restricted the supply of chips, chip design software, and lithography machines to Chinese companies.


Energy Shift
The World’s Biggest Oil Producers in 2023
Just three countries accounted for 40% of global oil production last year.

The World’s Biggest Oil Producers in 2023
This was originally posted on our Voronoi app. Download the app for free on iOS or Android and discover incredible data-driven charts from a variety of trusted sources.
Despite efforts to decarbonize the global economy, oil still remains one of the world’s most important resources. It’s also produced by a fairly limited group of countries, which can be a source of economic and political leverage.
This graphic illustrates global crude oil production in 2023, measured in million barrels per day, sourced from the U.S. Energy Information Administration (EIA).
Three Countries Account for 40% of Global Oil Production
In 2023, the United States, Russia, and Saudi Arabia collectively contributed 32.7 million barrels per day to global oil production.
| Oil Production 2023 | Million barrels per day |
|---|---|
| 🇺🇸 U.S. | 12.9 |
| 🇷🇺 Russia | 10.1 |
| 🇸🇦 Saudi Arabia | 9.7 |
| 🇨🇦 Canada | 4.6 |
| 🇮🇶 Iraq | 4.3 |
| 🇨🇳 China | 4.2 |
| 🇮🇷 Iran | 3.6 |
| 🇧🇷 Brazil | 3.4 |
| 🇦🇪 UAE | 3.4 |
| 🇰🇼 Kuwait | 2.7 |
| 🌍 Other | 22.8 |
These three nations have consistently dominated oil production since 1971. The leading position, however, has alternated among them over the past five decades.
In contrast, the combined production of the next three largest producers—Canada, Iraq, and China—reached 13.1 million barrels per day in 2023, just surpassing the production of the United States alone.
In the near term, no country is likely to surpass the record production achieved by the U.S. in 2023, as no other producer has ever reached a daily capacity of 13.0 million barrels. Recently, Saudi Arabia’s state-owned Saudi Aramco scrapped plans to increase production capacity to 13.0 million barrels per day by 2027.
In 2024, analysts forecast that the U.S. will maintain its position as the top oil producer. In fact, according to Macquarie Group, U.S. oil production is expected to achieve a record pace of about 14 million barrels per day by the end of the year.
Energy Shift
How Much Does the U.S. Depend on Russian Uranium?
Despite a new uranium ban being discussed in Congress, the U.S. is still heavily dependent on Russian uranium.

How Much Does the U.S. Depend on Russian Uranium?
This was originally posted on our Voronoi app. Download the app for free on iOS or Android and discover incredible data-driven charts from a variety of trusted sources.
The U.S. House of Representatives recently passed a ban on imports of Russian uranium. The bill must pass the Senate before becoming law.
In this graphic, we visualize how much the U.S. relies on Russian uranium, based on data from the United States Energy Information Administration (EIA).
U.S. Suppliers of Enriched Uranium
After Russia invaded Ukraine, the U.S. imposed sanctions on Russian-produced oil and gas—yet Russian-enriched uranium is still being imported.
Currently, Russia is the largest foreign supplier of nuclear power fuel to the United States. In 2022, Russia supplied almost a quarter of the enriched uranium used to fuel America’s fleet of more than 90 commercial reactors.
| Country of enrichment service | SWU* | % |
|---|---|---|
| 🇺🇸 United States | 3,876 | 27.34% |
| 🇷🇺 Russia | 3,409 | 24.04% |
| 🇩🇪 Germany | 1,763 | 12.40% |
| 🇬🇧 United Kingdom | 1,593 | 11.23% |
| 🇳🇱 Netherlands | 1,303 | 9.20% |
| Other | 2,232 | 15.79% |
| Total | 14,176 | 100% |
SWU stands for “Separative Work Unit” in the uranium industry. It is a measure of the amount of work required to separate isotopes of uranium during the enrichment process. Source: U.S. Energy Information Administration
Most of the remaining uranium is imported from European countries, while another portion is produced by a British-Dutch-German consortium operating in the United States called Urenco.
Similarly, nearly a dozen countries around the world depend on Russia for more than half of their enriched uranium—and many of them are NATO-allied members and allies of Ukraine.
In 2023 alone, the U.S. nuclear industry paid over $800 million to Russia’s state-owned nuclear energy corporation, Rosatom, and its fuel subsidiaries.
It is important to note that 19% of electricity in the U.S. is powered by nuclear plants.
The dependency on Russian fuels dates back to the 1990s when the United States turned away from its own enrichment capabilities in favor of using down-blended stocks of Soviet-era weapons-grade uranium.
As part of the new uranium-ban bill, the Biden administration plans to allocate $2.2 billion for the expansion of uranium enrichment facilities in the United States.

-

 Electrification3 years ago
Ranked: The Top 10 EV Battery Manufacturers
-

 Electrification2 years ago
The Key Minerals in an EV Battery
-

 Real Assets3 years ago
The World’s Top 10 Gold Mining Companies
-

 Misc3 years ago
All the Metals We Mined in One Visualization
-

 Electrification3 years ago
The Biggest Mining Companies in the World in 2021
-

 Energy Shift2 years ago
What Are the Five Major Types of Renewable Energy?
-

 Electrification2 years ago
Mapped: Solar Power by Country in 2021
-

 Electrification2 years ago
The World’s Largest Nickel Mining Companies