

Technology Metals
Charted: America’s Import Reliance of Critical Minerals
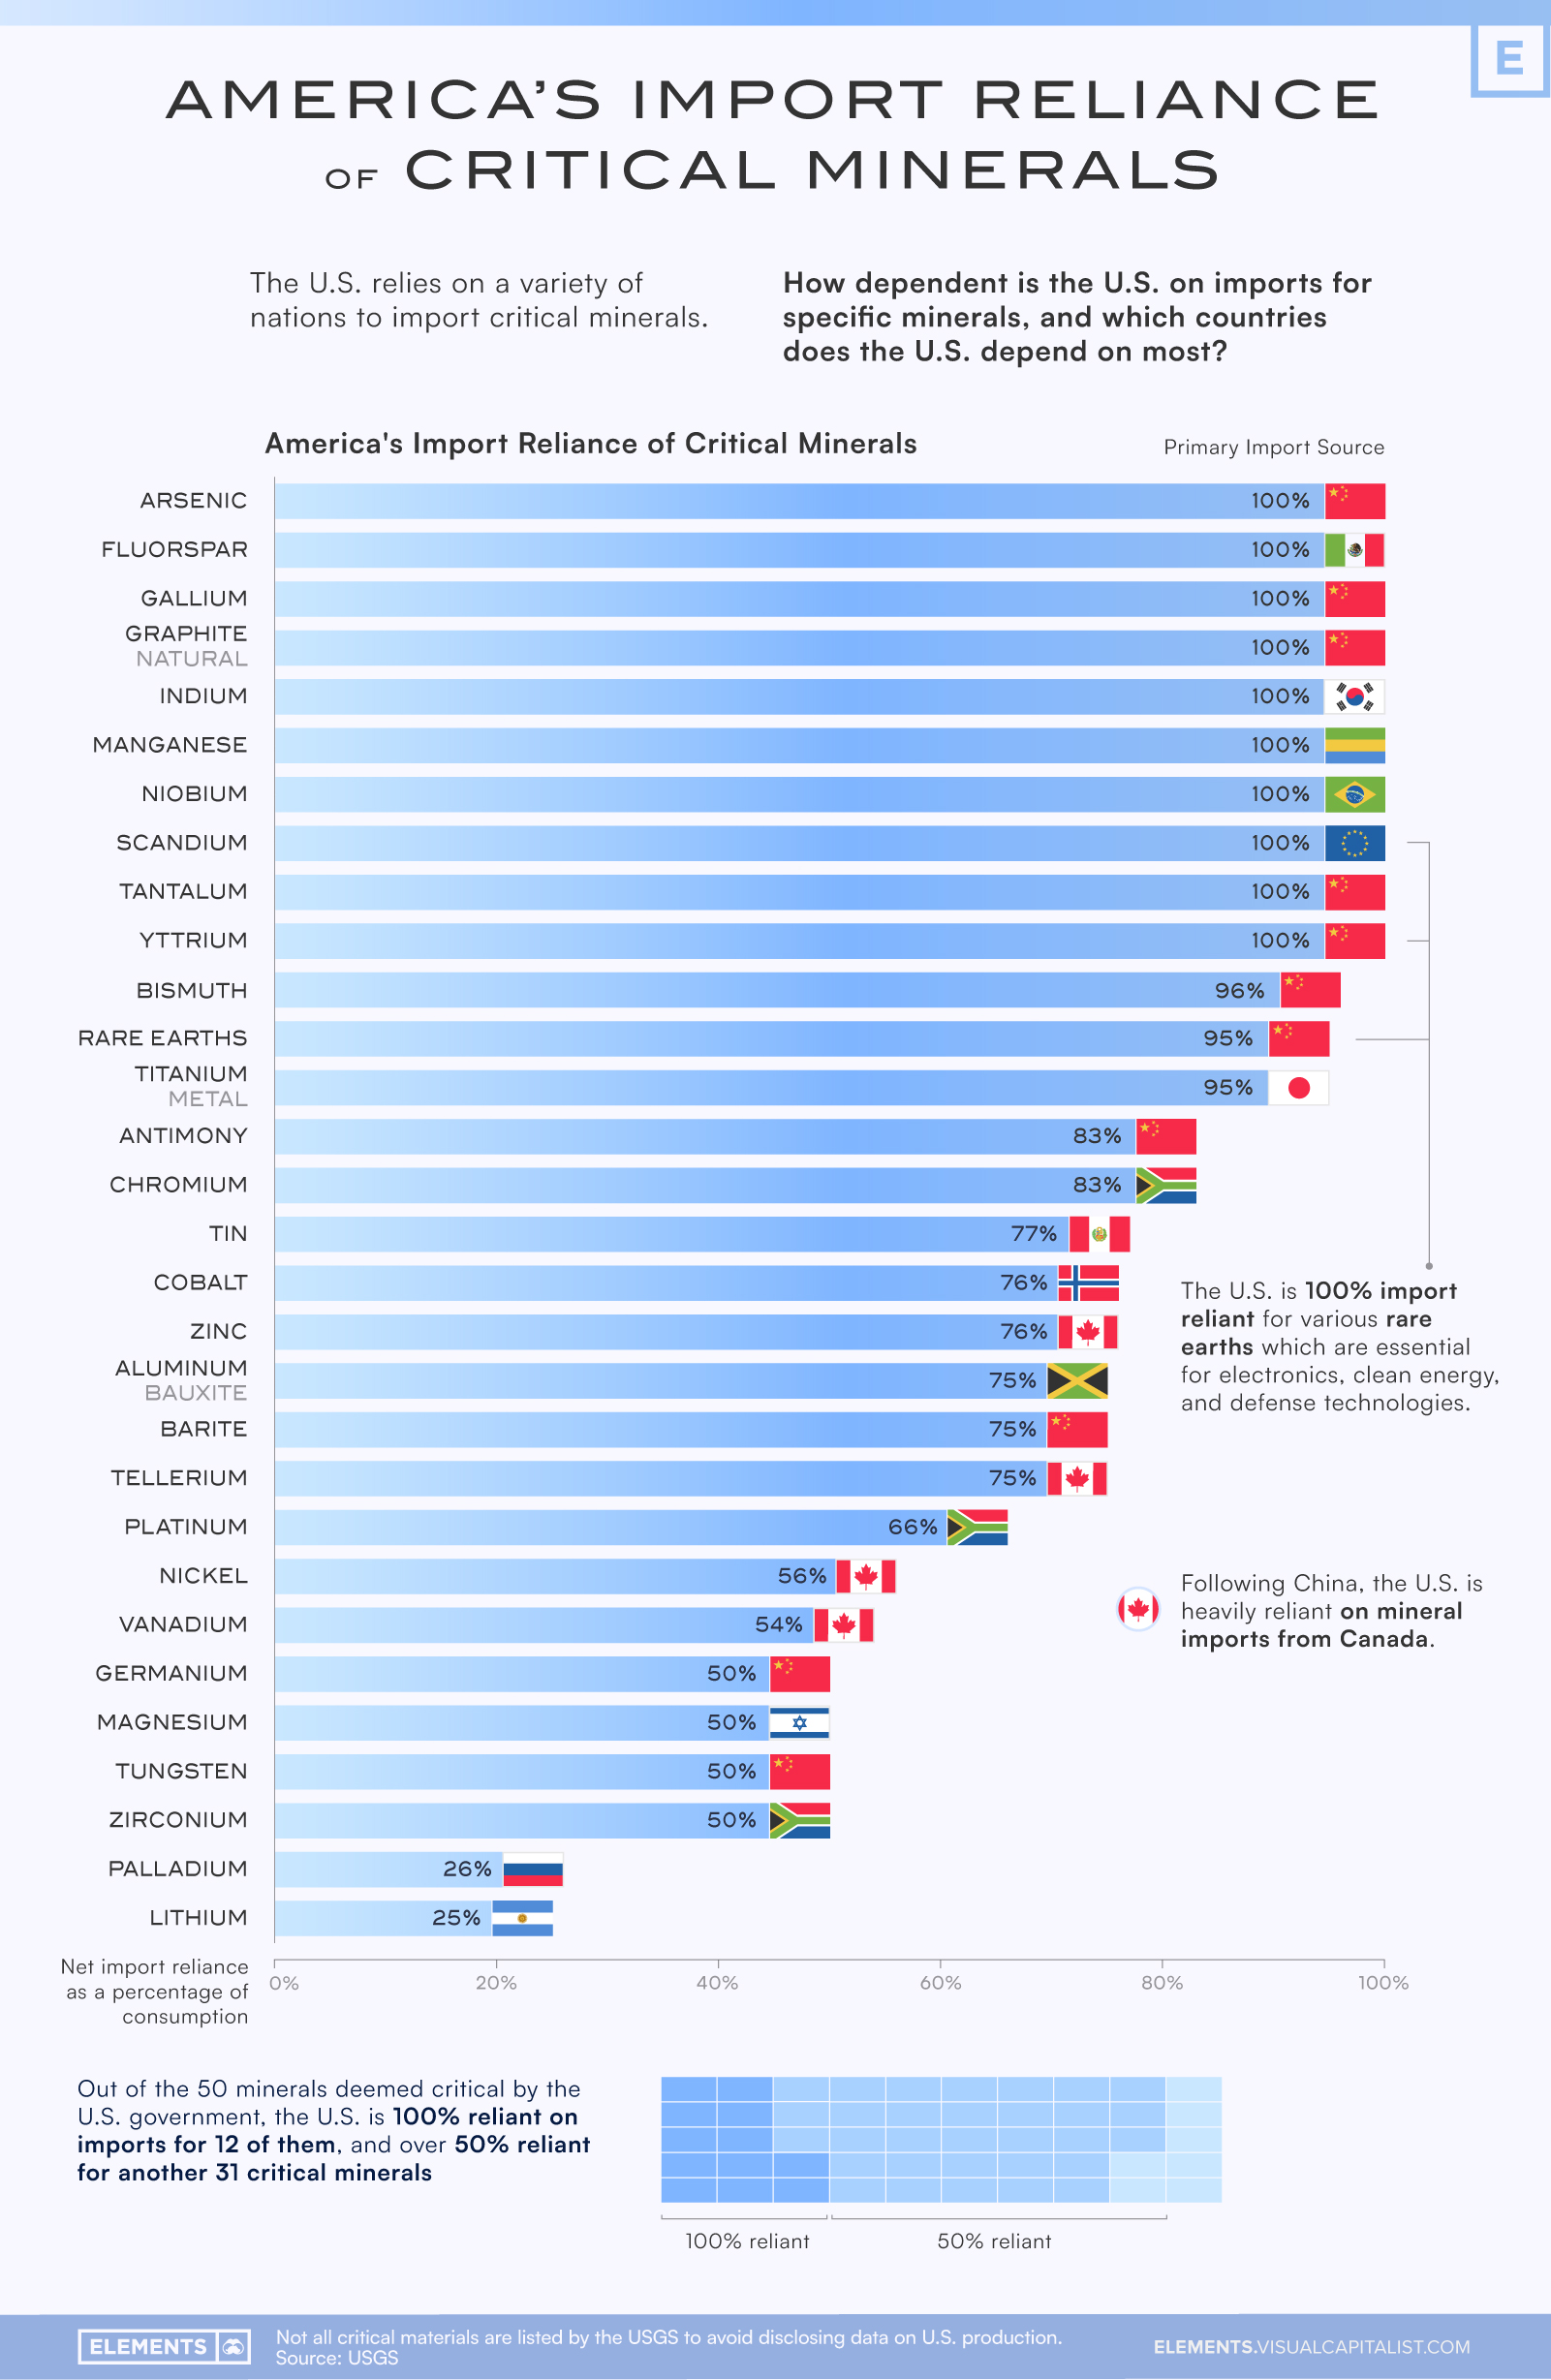
Charting America’s Import Reliance of Key Minerals
The push towards a more sustainable future requires various key minerals to build the infrastructure of the green economy. However, the U.S. is heavily reliant on nonfuel mineral imports causing potential vulnerabilities in the nation’s supply chains.
Specifically, the U.S. is 100% reliant on imports for at least 12 key minerals deemed critical by the government, with China being the primary import source for many of these along with many other critical minerals.
This graphic uses data from the U.S. Geological Survey (USGS) to visualize America’s import dependence for 30 different key nonfuel minerals along with the nation that the U.S. primarily imports each mineral from.
U.S. Import Reliance, by Mineral
While the U.S. mines and processes a significant amount of minerals domestically, in 2022 imports still accounted for more than half of the country’s consumption of 51 nonfuel minerals. The USGS calculates a net import reliance as a percentage of apparent consumption, showing how much of U.S. demand for each mineral is met through imports.
Of the most important minerals deemed by the USGS, the U.S. was 95% or more reliant on imports for 13 different minerals, with China being the primary import source for more than half of these.
| Mineral | Net Import Reliance as Percentage of Consumption | Primary Import Source (2018-2021) |
|---|---|---|
| Arsenic | 100% | 🇨🇳 China |
| Fluorspar | 100% | 🇲🇽 Mexico |
| Gallium | 100% | 🇨🇳 China |
| Graphite (natural) | 100% | 🇨🇳 China |
| Indium | 100% | 🇰🇷 Republic of Korea |
| Manganese | 100% | 🇬🇦 Gabon |
| Niobium | 100% | 🇧🇷 Brazil |
| Scandium | 100% | 🇪🇺 Europe |
| Tantalum | 100% | 🇨🇳 China |
| Yttrium | 100% | 🇨🇳 China |
| Bismuth | 96% | 🇨🇳 China |
| Rare Earths (compounds and metals) | 95% | 🇨🇳 China |
| Titanium (metal) | 95% | 🇯🇵 Japan |
| Antimony | 83% | 🇨🇳 China |
| Chromium | 83% | 🇿🇦 South Africa |
| Tin | 77% | 🇵🇪 Peru |
| Cobalt | 76% | 🇳🇴 Norway |
| Zinc | 76% | 🇨🇦 Canada |
| Aluminum (bauxite) | 75% | 🇯🇲 Jamaica |
| Barite | 75% | 🇨🇳 China |
| Tellerium | 75% | 🇨🇦 Canada |
| Platinum | 66% | 🇿🇦 South Africa |
| Nickel | 56% | 🇨🇦 Canada |
| Vanadium | 54% | 🇨🇦 Canada |
| Germanium | 50% | 🇨🇳 China |
| Magnesium | 50% | 🇮🇱 Israel |
| Tungsten | 50% | 🇨🇳 China |
| Zirconium | 50% | 🇿🇦 South Africa |
| Palladium | 26% | 🇷🇺 Russia |
| Lithium | 25% | 🇦🇷 Argentina |
These include rare earths (a group of 17 nearly indistinguishable heavy metals with similar properties) which are essential in technology, high-powered magnets, electronics, and industry, along with natural graphite which is found in lithium-ion batteries.
These are all on the U.S. government’s critical mineral list which has a total of 50 minerals, and the U.S. is 50% or more import reliant for 43 of these minerals.
Some other minerals on the official list which the U.S. is 100% reliant on imports for are arsenic, fluorspar, indium, manganese, niobium, and tantalum, which are used in a variety of applications like the production of alloys and semiconductors along with the manufacturing of electronic components like LCD screens and capacitors.
China’s Gallium and Germanium Restrictions
America’s dependence on imports for various minerals has resulted in a new challenge resulting from China’s announced export restrictions on gallium and germanium that took effect August 1st, 2023. The U.S. is 100% import dependent for gallium and 50% import dependent for germanium.
These restrictions are seen as a retaliation against U.S. and EU sanctions on China which have restricted the export of chips and chipmaking equipment.
Both gallium and germanium are used in the production of transistors and semiconductors along with solar panels and cells, and these export restrictions present an additional hurdle for critical U.S. supply chains of various technologies that include LED lights and fiber-optic systems used for high-speed data transmission.
The restrictions also affect the European Union, which imports 71% of its gallium and 45% of its germanium from China. It’s another stark reminder to the world of China’s dominance in the production and processing of many key minerals.
The announcement of these restrictions has only highlighted the importance for the U.S. and other nations to reduce import dependence and diversify supply chains of key minerals and technologies.


Energy Shift
China Dominates the Supply of U.S. Critical Minerals List
China was the world’s leading producer of 30 out of 50 entries on the U.S. critical minerals list, according to the U.S. Geological Survey.
China Dominates the Supply of U.S. Critical Minerals List
This was originally posted on our Voronoi app. Download the app for free on iOS or Android and discover incredible data-driven charts from a variety of trusted sources.
Most countries have, for many decades, kept a record of their own critical minerals list.
For example, the U.S., drew up a list of “war minerals” during World War I, containing important minerals which could not be found and produced in abundance domestically. They included: tin, nickel, platinum, nitrates and potash.
Since then, as the economy has grown and innovated, critical mineral lists have expanded considerably. The Energy Act of 2020 defines a critical mineral as:
“A non-fuel mineral or mineral material essential to the economic or national security of the U.S., whose supply chains are vulnerable to disruption.” — Energy Act, 2020.
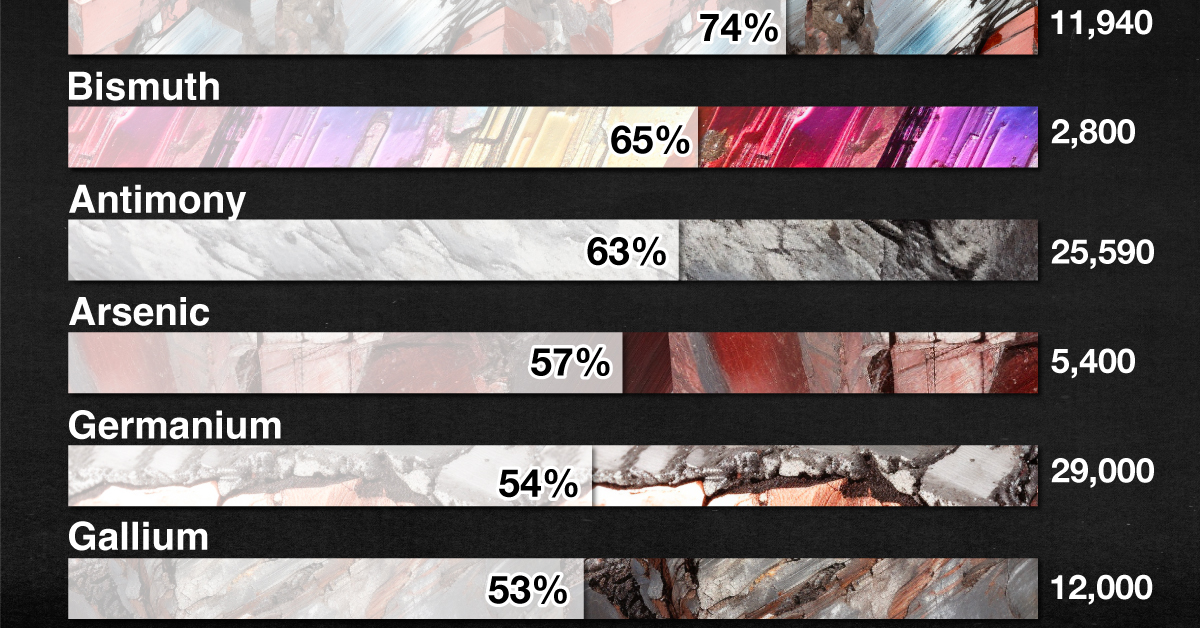
Currently there are 50 entries on this list and the U.S. Geological Survey (USGS) estimates that China is the leading producer for 30 of them. From USGS data, we visualize China’s share of U.S. imports for 10 critical minerals.
What Key Critical Minerals Does the U.S. Import From China?
The U.S. is 100% import-reliant for its supply of yttrium, with China responsible for 94% of U.S. imports of the metal from 2018 to 2021.
A soft silvery metal, yttrium is used as an additive for alloys, making microwave filters for radars, and as a catalyst in ethylene polymerization—a key process in making certain kinds of plastic.
China is a major supplier of the following listed critical minerals to the U.S.
| Critical Mineral | China's Share of U.S. Imports | U.S. Imports (Tonnes) | Uses |
|---|---|---|---|
| Yttrium | 94% | 1,000 | Catalyst, Microwave filters |
| Rare Earths | 74% | 11,940 | Smartphones, Cameras |
| Bismuth | 65% | 2,800 | Metallurgy |
| Antimony | 63% | 25,590 | Batteries |
| Arsenic | 57% | 5,400 | Semiconductors |
| Germanium | 54% | 29,000 | Chips, Fiber optics |
| Gallium | 53% | 12,000 | Chips, Fiber optics |
| Barite | 38% | 2,300 | Hydrocarbon production |
| Graphite (natural) | 33% | 82,000 | Batteries, Lubricants |
| Tungsten | 29% | 14,000 | Metallurgy |
Note: China’s share of U.S. critical minerals imports is based on average imports from 2018 to 2021.
Meanwhile, the U.S. also imports nearly three-quarters of its rare earth compounds and metals demand from China. Rare earth elements—so called since they are not found in easily-mined, concentrated clusters—are a collection of 15 elements on the periodic table, known as the lanthanide series.
Rare earths are used in smartphones, cameras, hard disks, and LEDs but also, crucially, in the clean energy and defense industries.
Does China’s Dominance of U.S. Critical Minerals Supply Matter?
The USGS estimates that China could potentially disrupt the global rare earth oxide supply by cutting off 40–50% production, impacting suppliers of advanced components used in U.S. defense systems.
A version of this sort of trade warfare is already playing out. Earlier this year, China implemented export controls on germanium and gallium. The U.S. relies on China for around 54% of its demand for both minerals, used for producing chips, solar panels, and fiber optics.
China’s controls were seen as a retaliation against the U.S. which has restricted the supply of chips, chip design software, and lithography machines to Chinese companies.
Technology Metals
The Critical Minerals to China, EU, and U.S. National Security
Ten materials, including cobalt, lithium, graphite, and rare earths, are deemed critical by all three.
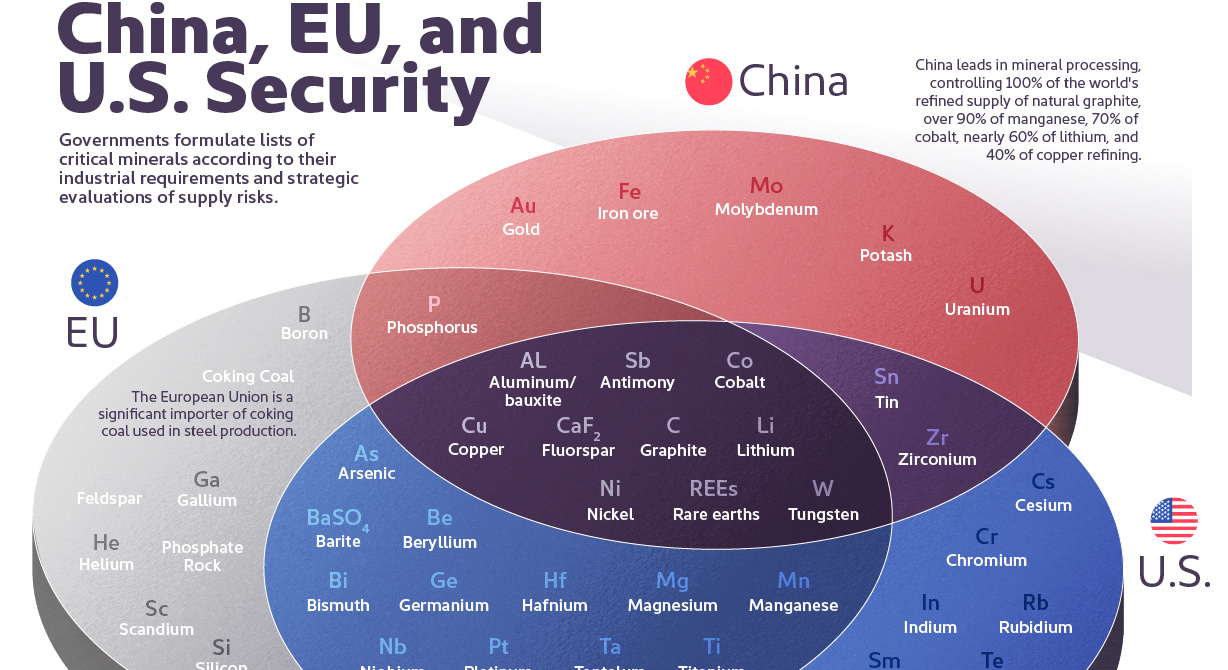
The Critical Minerals to China, EU, and U.S. Security
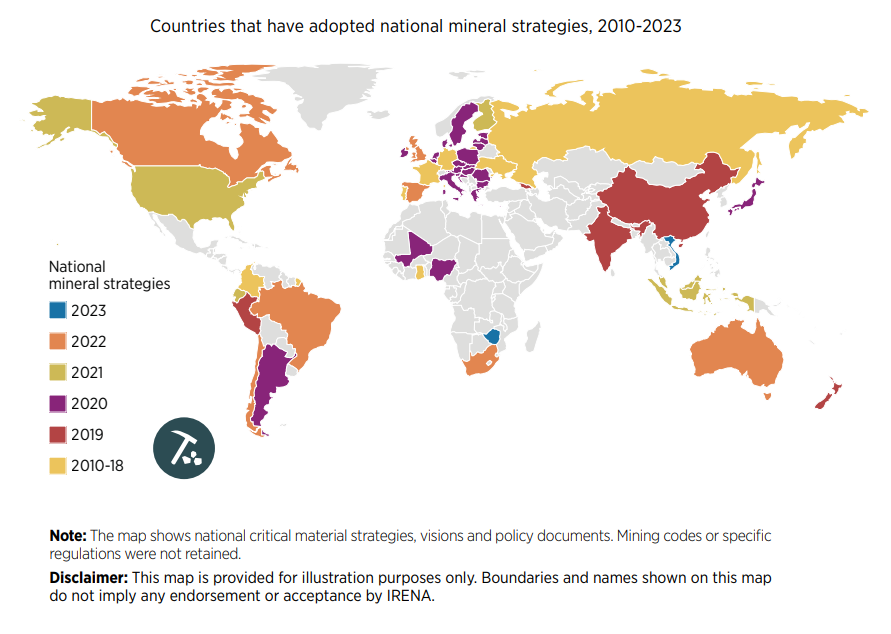
Governments formulate lists of critical minerals according to their industrial requirements and strategic evaluations of supply risks.
Over the last decade, minerals like nickel, copper, and lithium have been on these lists and deemed essential for clean technologies like EV batteries and solar and wind power.
This graphic uses IRENA and the U.S. Department of Energy data to identify which minerals are essential to China, the United States, and the European Union.
What are Critical Minerals?
There is no universally accepted definition of critical minerals. Countries and regions maintain lists that mirror current technology requirements and supply and demand dynamics, among other factors.
These lists are also constantly changing. For example, the EU’s first critical minerals list in 2011 featured only 14 raw materials. In contrast, the 2023 version identified 34 raw materials as critical.
One thing countries share, however, is the concern that a lack of minerals could slow down the energy transition.
With most countries committed to reducing greenhouse gas emissions, the total mineral demand from clean energy technologies is expected to double by 2040.
U.S. and EU Seek to Reduce Import Reliance on Critical Minerals
Ten materials feature on critical material lists of both the U.S., the EU, and China, including cobalt, lithium, graphite, and rare earths.
| Mineral / Considered Critical | 🇺🇸 U.S. | 🇪🇺 EU | 🇨🇳 China |
|---|---|---|---|
| Aluminum/ bauxite | Yes | Yes | Yes |
| Antimony | Yes | Yes | Yes |
| Cobalt | Yes | Yes | Yes |
| Copper | Yes | Yes | Yes |
| Fluorspar | Yes | Yes | Yes |
| Graphite | Yes | Yes | Yes |
| Lithium | Yes | Yes | Yes |
| Nickel | Yes | Yes | Yes |
| Rare earths | Yes | Yes | Yes |
| Tungsten | Yes | Yes | Yes |
| Arsenic | Yes | Yes | No |
| Barite | Yes | Yes | No |
| Beryllium | Yes | Yes | No |
| Bismuth | Yes | Yes | No |
| Germanium | Yes | Yes | No |
| Hafnium | Yes | Yes | No |
| Magnesium | Yes | Yes | No |
| Manganese | Yes | Yes | No |
| Niobium | Yes | Yes | No |
| Platinum | Yes | Yes | No |
| Tantalum | Yes | Yes | No |
| Titanium | Yes | Yes | No |
| Vanadium | Yes | Yes | No |
| Tin | Yes | No | Yes |
| Zirconium | Yes | No | Yes |
| Phosphorus | No | Yes | Yes |
| Cesium | Yes | No | No |
| Chromium | Yes | No | No |
| Indium | Yes | No | No |
| Rubidium | Yes | No | No |
| Samarium | Yes | No | No |
| Tellurium | Yes | No | No |
| Zinc | Yes | No | No |
| Boron | No | Yes | No |
| Coking Coal | No | Yes | No |
| Feldspar | No | Yes | No |
| Gallium | No | Yes | No |
| Helium | No | Yes | No |
| Phosphate Rock | No | Yes | No |
| Scandium | No | Yes | No |
| Silicon | No | Yes | No |
| Strontium | No | Yes | No |
| Gold | No | No | Yes |
| Iron ore | No | No | Yes |
| Molybdenum | No | No | Yes |
| Potash | No | No | Yes |
| Uranium | No | No | Yes |
Despite having most of the same materials found in the U.S. or China’s list, the European list is the only one to include phosphate rock. The region has limited phosphate resources (only produced in Finland) and largely depends on imports of the material essential for manufacturing fertilizers.
Coking coal is also only on the EU list. The material is used in the manufacture of pig iron and steel. Production is currently dominated by China (58%), followed by Australia (17%), Russia (7%), and the U.S. (7%).
The U.S. has also sought to reduce its reliance on imports. Today, the country is 100% import-dependent on manganese and graphite and 76% on cobalt.
After decades of sourcing materials from other countries, the U.S. local production of raw materials has become extremely limited. For instance, there is only one operating nickel mine (primary) in the country, the Eagle Mine in Michigan. Likewise, the country only hosts one lithium source in Nevada, the Silver Peak Mine.
China’s Dominance
Despite being the world’s biggest carbon polluter, China is the largest producer of most of the world’s critical minerals for the green revolution.
China produces 60% of all rare earth elements used as components in high-technology devices, including smartphones and computers. The country also has a 13% share of the lithium production market. In addition, it refines around 35% of the world’s nickel, 58% of lithium, and 70% of cobalt.
Among some of the unique materials on China’s list is gold. Although gold is used on a smaller scale in technology, China has sought gold for economic and geopolitical factors, mainly to diversify its foreign exchange reserves, which rely heavily on the U.S. dollar.
Analysts estimate China has bought a record 400 tonnes of gold in recent years.
China has also slated uranium as a critical mineral. The Chinese government has stated it intends to become self-sufficient in nuclear power plant capacity and fuel production for those plants.
According to the World Nuclear Association, China aims to produce one-third of its uranium domestically.

-

 Electrification3 years ago
Ranked: The Top 10 EV Battery Manufacturers
-

 Electrification2 years ago
The Key Minerals in an EV Battery
-

 Real Assets3 years ago
The World’s Top 10 Gold Mining Companies
-

 Misc3 years ago
All the Metals We Mined in One Visualization
-

 Electrification3 years ago
The Biggest Mining Companies in the World in 2021
-

 Energy Shift2 years ago
What Are the Five Major Types of Renewable Energy?
-

 Electrification2 years ago
Mapped: Solar Power by Country in 2021
-

 Electrification2 years ago
The World’s Largest Nickel Mining Companies