

Just three countries accounted for 40% of global oil production last year.


Over the last decade, the U.S. has surpassed Saudi Arabia and Russia as the world's top producer of crude oil.


In this graphic, we break down where the $400 billion lithium battery industry will generate revenue in 2030.


Just three countries—the U.S., Saudi Arabia and Russia—make up the lion’s share of global oil supply. Here are the world's biggest oil producers.
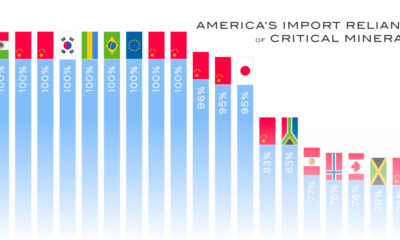

The U.S. is heavily reliant on imports for many critical minerals. How import-dependent is the U.S. for each one, and on which country?
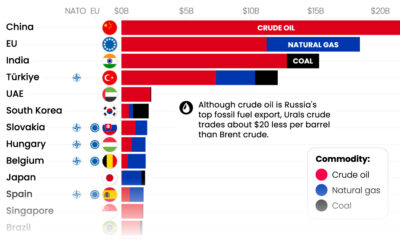

With Russia’s revenues from fossil fuel exports having declined significantly, which countries are still importing Russian fossil fuels?
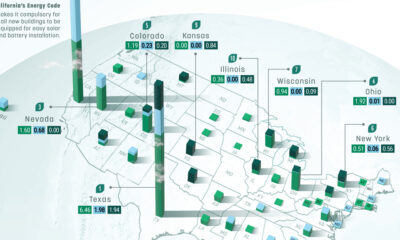

This graphic describes new U.S. renewable energy installations by state along with nameplate capacity, planned to come online in 2023.
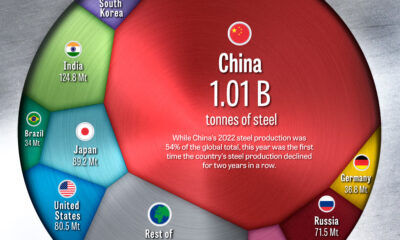

China has dominated global steel production the past few decades, but how did the country get here, and is its production growth over?
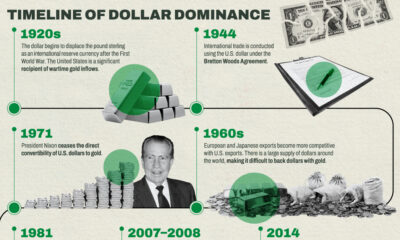

The U.S. dollar is the dominant currency in the global financial system, but some countries are following the trend of de-dollarization.
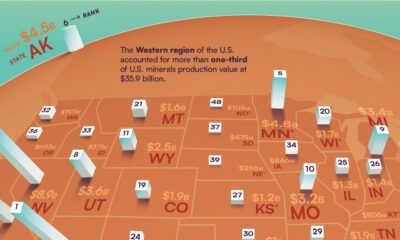

U.S. mineral production value increased by 4% YoY in 2022 to reach $98.2 billion. Which states contributed the most to domestic mineral production?


