

Electrification
The Six Major Types of Lithium-ion Batteries: A Visual Comparison


The Six Types of Lithium-ion Batteries: A Visual Comparison
Lithium-ion batteries are at the center of the clean energy transition as the key technology powering electric vehicles (EVs) and energy storage systems.
However, there are many types of lithium-ion batteries, each with pros and cons.
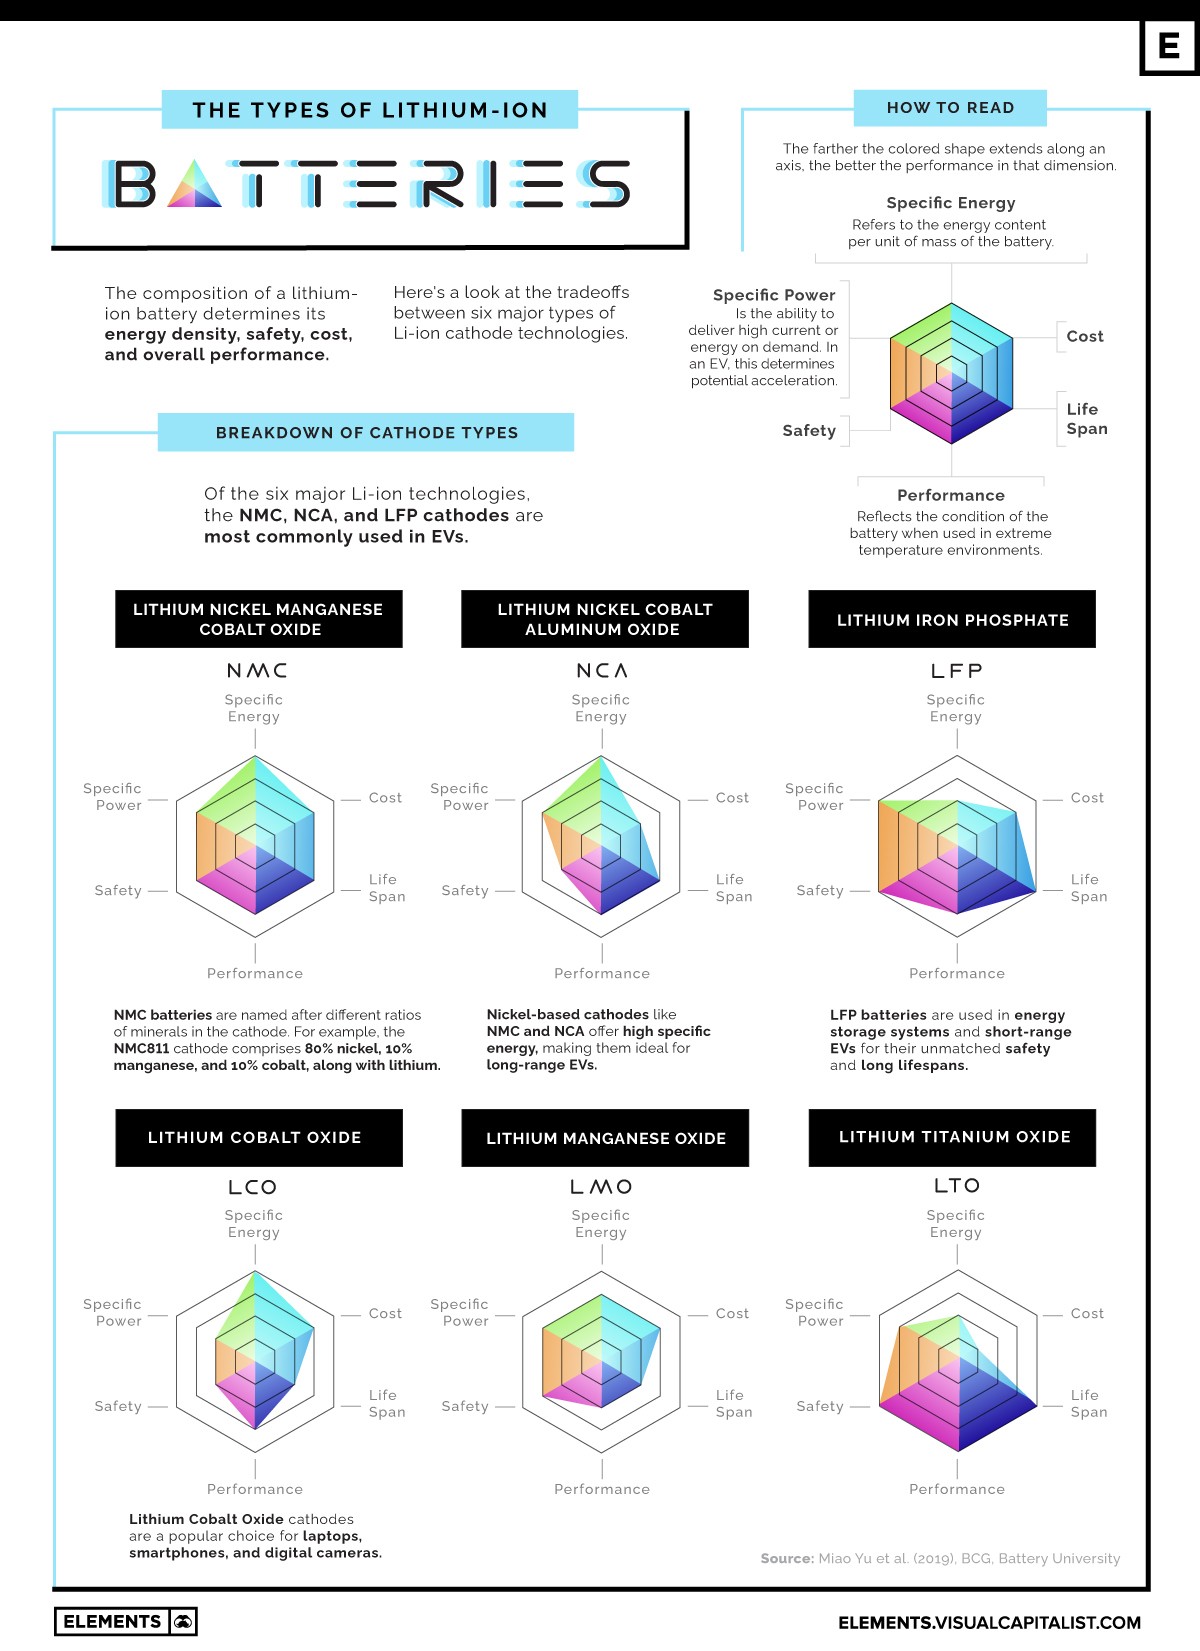
The above infographic shows the tradeoffs between the six major lithium-ion cathode technologies based on research by Miao et al. and Battery University. This is the first of two infographics in our Battery Technology Series.
Understanding the Six Main Lithium-ion Technologies
Each of the six different types of lithium-ion batteries has a different chemical composition.
The anodes of most lithium-ion batteries are made from graphite. Typically, the mineral composition of the cathode is what changes, making the difference between battery chemistries.
The cathode material typically contains lithium along with other minerals including nickel, manganese, cobalt, or iron. This composition ultimately determines the battery’s capacity, power, performance, cost, safety, and lifespan.
With that in mind, let’s take a look at the six major lithium-ion cathode technologies.
#1: Lithium Nickel Manganese Cobalt Oxide (NMC)
NMC cathodes typically contain large proportions of nickel, which increases the battery’s energy density and allows for longer ranges in EVs. However, high nickel content can make the battery unstable, which is why manganese and cobalt are used to improve thermal stability and safety. Several NMC combinations have seen commercial success, including NMC811 (composed of 80% nickel, 10% manganese, and 10% cobalt), NMC532, and NMC622.
#2: Lithium Nickel Cobalt Aluminum Oxide (NCA)
NCA batteries share nickel-based advantages with NMC, including high energy density and specific power. Instead of manganese, NCA uses aluminum to increase stability. However, NCA cathodes are relatively less safe than other Li-ion technologies, more expensive, and typically only used in high-performance EV models.
#3: Lithium Iron Phosphate (LFP)
Due to their use of iron and phosphate instead of nickel and cobalt, LFP batteries are cheaper to make than nickel-based variants. However, they offer lesser specific energy and are more suitable for standard- or short-range EVs. Additionally, LFP is considered one of the safest chemistries and has a long lifespan, enabling its use in energy storage systems.
#4: Lithium Cobalt Oxide (LCO)
Although LCO batteries are highly energy-dense, their drawbacks include a relatively short lifespan, low thermal stability, and limited specific power. Therefore, these batteries are a popular choice for low-load applications like smartphones and laptops, where they can deliver relatively smaller amounts of power for long durations.
#5: Lithium Manganese Oxide (LMO)
Also known as manganese spinel batteries, LMO batteries offer enhanced safety and fast charging and discharging capabilities. In EVs, LMO cathode material is often blended with NMC, where the LMO part provides a high current upon acceleration, and NMC enables longer driving ranges.
#6: Lithium Titanate (LTO)
Unlike the other chemistries above, where the cathode composition makes the difference, LTO batteries use a unique anode surface made of lithium and titanium oxides. These batteries exhibit excellent safety and performance under extreme temperatures but have low capacity and are relatively expensive, limiting their use at scale.
Which Batteries Dominate the EV Market?
Now that we know about the six main types of lithium-ion batteries, which of these dominate the EV market, and how will that change in the future?
To find out, stay tuned for Part 2 of the Battery Technology Series, where we’ll look at the top EV battery chemistries by forecasted market share from 2021 through 2026.


Electrification
Ranked: The Top 10 EV Battery Manufacturers in 2023
Asia dominates this ranking of the world’s largest EV battery manufacturers in 2023.

The Top 10 EV Battery Manufacturers in 2023
This was originally posted on our Voronoi app. Download the app for free on iOS or Android and discover incredible data-driven charts from a variety of trusted sources.
Despite efforts from the U.S. and EU to secure local domestic supply, all major EV battery manufacturers remain based in Asia.
In this graphic we rank the top 10 EV battery manufacturers by total battery deployment (measured in megawatt-hours) in 2023. The data is from EV Volumes.
Chinese Dominance
Contemporary Amperex Technology Co. Limited (CATL) has swiftly risen in less than a decade to claim the title of the largest global battery group.
The Chinese company now has a 34% share of the market and supplies batteries to a range of made-in-China vehicles, including the Tesla Model Y, SAIC’s MG4/Mulan, and Li Auto models.
| Company | Country | 2023 Production (megawatt-hour) | Share of Total Production |
|---|---|---|---|
| CATL | 🇨🇳China | 242,700 | 34% |
| BYD | 🇨🇳China | 115,917 | 16% |
| LG Energy Solution | 🇰🇷Korea | 108,487 | 15% |
| Panasonic | 🇯🇵Japan | 56,560 | 8% |
| SK On | 🇰🇷Korea | 40,711 | 6% |
| Samsung SDI | 🇰🇷Korea | 35,703 | 5% |
| CALB | 🇨🇳China | 23,493 | 3% |
| Farasis Energy | 🇨🇳China | 16,527 | 2% |
| Envision AESC | 🇨🇳China | 8,342 | 1% |
| Sunwoda | 🇨🇳China | 6,979 | 1% |
| Other | - | 56,040 | 8% |
In 2023, BYD surpassed LG Energy Solution to claim second place. This was driven by demand from its own models and growth in third-party deals, including providing batteries for the made-in-Germany Tesla Model Y, Toyota bZ3, Changan UNI-V, Venucia V-Online, as well as several Haval and FAW models.
The top three battery makers (CATL, BYD, LG) collectively account for two-thirds (66%) of total battery deployment.
Once a leader in the EV battery business, Panasonic now holds the fourth position with an 8% market share, down from 9% last year. With its main client, Tesla, now effectively sourcing batteries from multiple suppliers, the Japanese battery maker seems to be losing its competitive edge in the industry.
Overall, the global EV battery market size is projected to grow from $49 billion in 2022 to $98 billion by 2029, according to Fortune Business Insights.
Electrification
White Gold: Mapping U.S. Lithium Mines
In this graphic, Visual Capitalist partnerered with EnergyX to explore the size and location of U.S. lithium mines.

White Gold: Mapping U.S. Lithium Mines
The U.S. doubled imports of lithium-ion batteries for the third consecutive year in 2022, and with EV demand growing yearly, U.S. lithium mines must ramp up production or rely on other nations for their supply of refined lithium.
To determine if the domestic U.S. lithium opportunity can meet demand, we partnered with EnergyX to determine how much lithium sits within U.S. borders.
U.S. Lithium Projects
The most crucial measure of a lithium mine’s potential is the quantity that can be extracted from the source.
For each lithium resource, the potential volume of lithium carbonate equivalent (LCE) was calculated with a ratio of one metric ton of lithium producing 5.32 metric tons of LCE. Cumulatively, existing U.S. lithium projects contain 94.8 million metric tons of LCE.
| Rank | Project Name | LCE, million metric tons (est.) |
|---|---|---|
| 1 | McDermitt Caldera | 21.5 |
| 2 | Thacker Pass | 19.1 |
| 3 | Tonopah Flats | 18.0 |
| 4 | TLC Lithium | 10.7 |
| 5 | Clayton Valley (Century Lithium) | 6.3 |
| 6 | Zeus Lithium | 6.3 |
| 7 | Rhyolite Ridge | 3.4 |
| 8 | Arkansas Smackover (Phase 1A) | 2.8 |
| 9 | Basin Project | 2.2 |
| 10 | McGee Deposit | 2.1 |
| 11 | Arkansas Smackover (South West) | 1.8 |
| 12 | Clayton Valley (Lithium-X, Pure Energy) | 0.8 |
| 13 | Big Sandy | 0.3 |
| 14 | Imperial Valley/Salton Sea | 0.3 |
U.S. Lithium Opportunities, By State
U.S. lithium projects mainly exist in western states, with comparatively minor opportunities in central or eastern states.
| State | LCE, million metric tons (est.) |
|---|---|
| Nevada | 88.2 |
| Arkansas | 4.6 |
| Arizona | 2.5 |
| California | 0.3 |
Currently, the U.S. is sitting on a wealth of lithium that it is underutilizing. For context, in 2022, the U.S. only produced about 5,000 metric tons of LCE and imported a projected 19,000 metric tons of LCE, showing that the demand for the mineral is healthy.
The Next Gold Rush?
U.S. lithium companies have the opportunity to become global leaders in lithium production and accelerate the transition to sustainable energy sources. This is particularly important as the demand for lithium is increasing every year.
EnergyX is on a mission to meet U.S. lithium demands using groundbreaking technology that can extract 300% more lithium from a source than traditional methods.
You can take advantage of this opportunity by investing in EnergyX and joining other significant players like GM in becoming a shareholder.


-

 Electrification3 years ago
Ranked: The Top 10 EV Battery Manufacturers
-

 Electrification2 years ago
The Key Minerals in an EV Battery
-

 Real Assets3 years ago
The World’s Top 10 Gold Mining Companies
-

 Misc3 years ago
All the Metals We Mined in One Visualization
-

 Electrification3 years ago
The Biggest Mining Companies in the World in 2021
-

 Energy Shift2 years ago
What Are the Five Major Types of Renewable Energy?
-

 Electrification2 years ago
The World’s Largest Nickel Mining Companies
-

 Electrification2 years ago
Mapped: Solar Power by Country in 2021