
Ten materials, including cobalt, lithium, graphite, and rare earths, are deemed critical by all three.


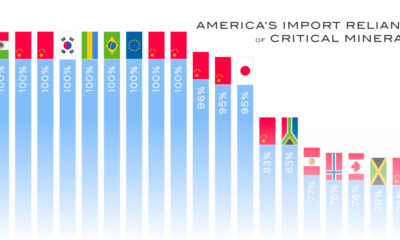
The U.S. is heavily reliant on imports for many critical minerals. How import-dependent is the U.S. for each one, and on which country?


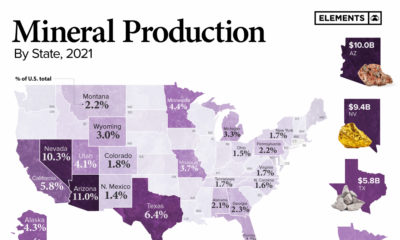
U.S. mineral production value increased by 4% YoY in 2022 to reach $98.2 billion. Which states contributed the most to domestic mineral production?


Aggregates account for half of the industrial minerals produced in the United States.


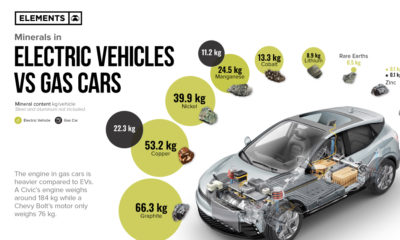
Electric vehicles can have 6 times more minerals than a combustion vehicle and be on average 340 kg heavier.


This infographic breaks down $90.4 billion in non-fuel mineral production by state.


The amount of human-made (or anthropogenic) mass, has now exceeded the weight of all life on Earth, including humans, animals, and plants.


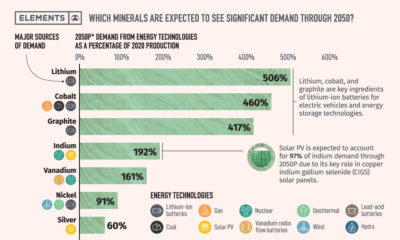
Energy technologies are often mineral-intensive. This chart shows how the energy shift is creating massive demand for minerals.


This infographic is a unique look at the estimated 217 billion m³ of mine tailings around the world.


This massive infographic reveals the dramatic scale of 2019 non-fuel mineral global production.