

Misc
Mapped: U.S. Mineral Production, by State
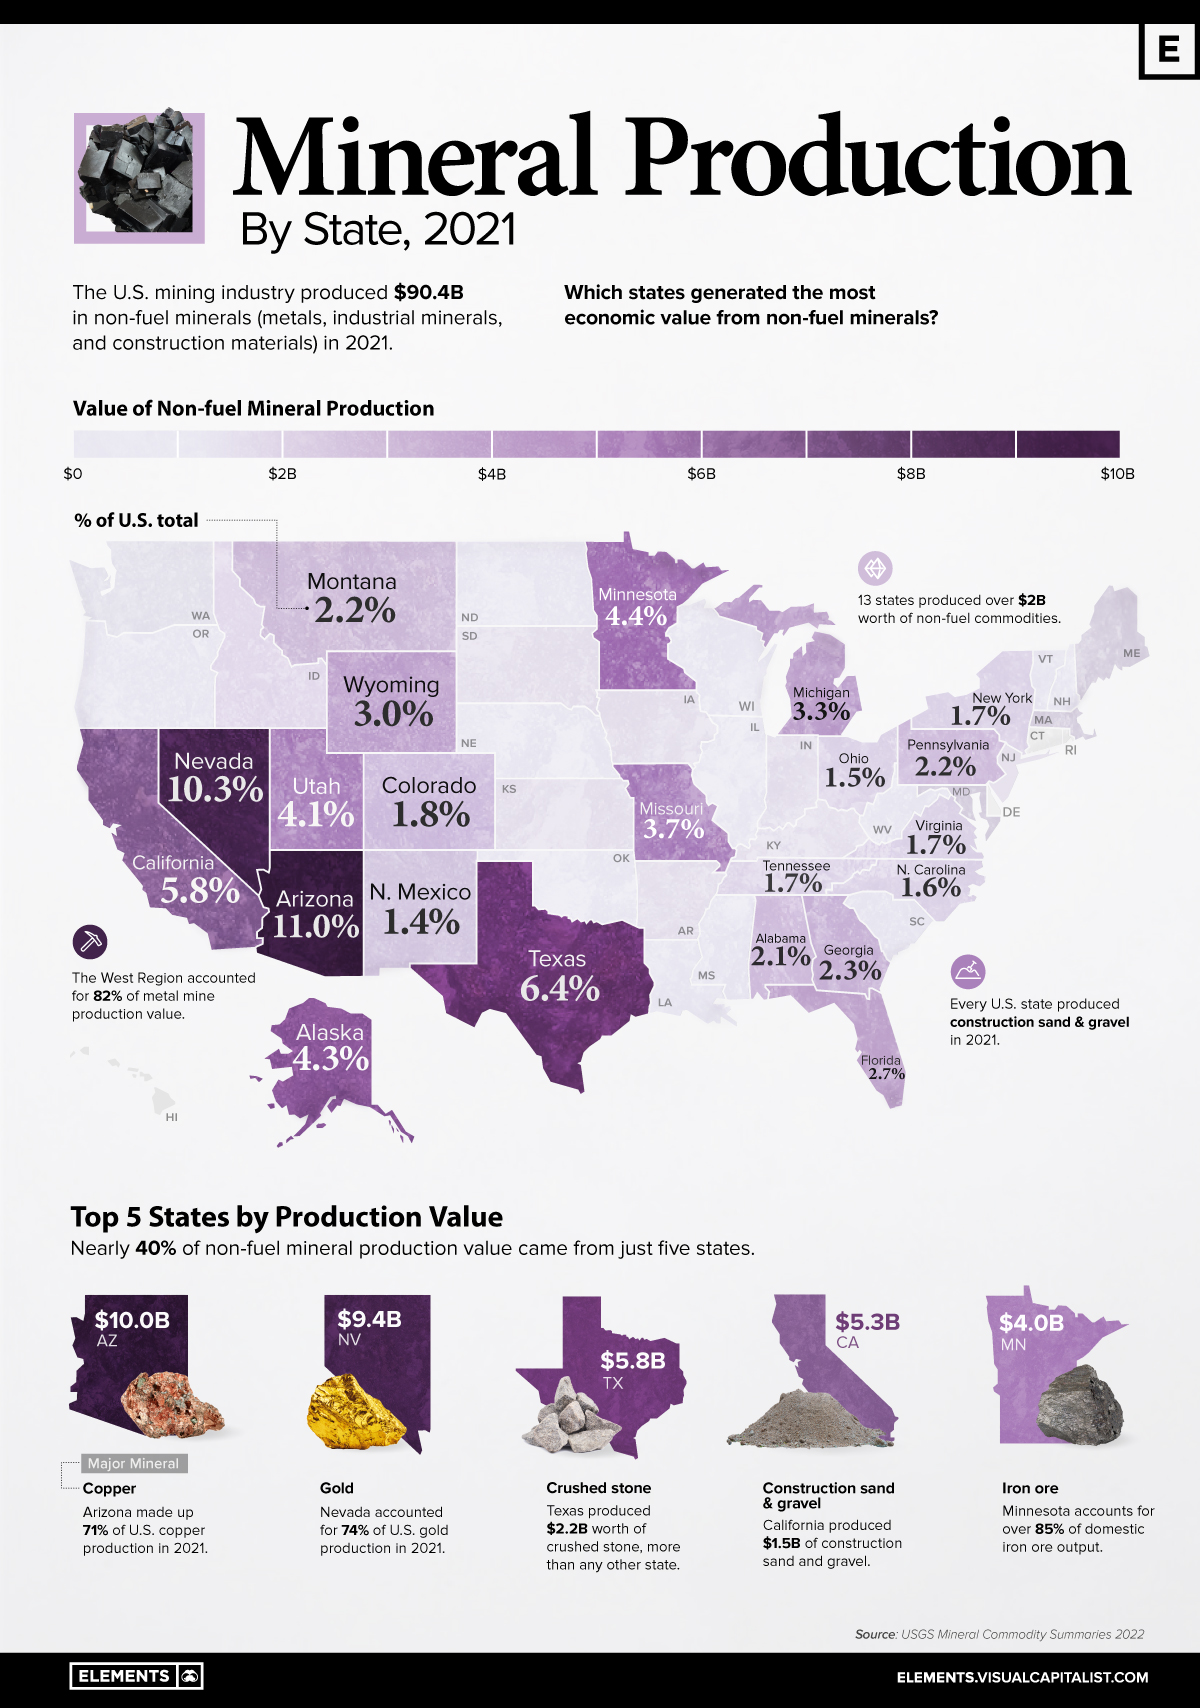
Mapped: U.S. Non-fuel Mineral Production, by State
Just how many minerals does the U.S. consume? In 2020, non-fuel mineral consumption worked out to around 19,000 pounds or 8.6 tonnes per person.
This includes metals like copper, iron ore, and zinc, along with construction sand, stone, cement, and other industrial minerals. With such high demand, changes in the production of these commodities often reflect how the overall economy is performing.
The above infographic maps U.S. non-fuel mineral production by state in 2021 using data from the United States Geological Survey (USGS).
The Most Valuable Minerals
As the U.S. economy restarted in 2021, American mines generated over $90 billion in non-fuel mineral production, a 12% increase from 2020.
Before diving into the breakdown by state, here’s a look at production value by mineral type:
| Category | Production value | % of Total |
|---|---|---|
| Metals | $33.8B | 37.4% |
| Construction aggregates | $29.2B | 32.3% |
| Industrial minerals (excl. construction) | $27.4B | 30.3% |
| Total | $90.4B | 100% |
Each of the categories accounted for roughly one-third of the total production value, with metals making up the largest share. Within metals, copper and gold collectively accounted for 66% of the total, followed by iron ore (13%) and zinc (7%).
The production of sand, gravel, and crushed stone—important inputs for construction—also made up a significant chunk of the value, along with other industrial minerals. Furthermore, crushed stone was the leading non-fuel mineral in 2021, with $19.3 billion in production value.
Which States Lead in Mineral Production?
Arizona, Nevada, Texas, California, and Minnesota—the top five states—accounted for nearly 40% of non-fuel mineral production value.
| State | Value of Non-fuel Mineral Production | % of Total |
|---|---|---|
| Arizona | $10B | 11.0% |
| Nevada | $9.4B | 10.3% |
| Texas | $5.8B | 6.4% |
| California | $5.3B | 5.8% |
| Minnesota | $4.0B | 4.4% |
| Alaska | $3.9B | 4.3% |
| Utah | $3.8B | 4.1% |
| Missouri | $3.3B | 3.7% |
| Michigan | $3.0B | 3.3% |
| Wyoming | $2.8B | 3.0% |
| Florida | $2.4B | 2.7% |
| Georgia | $2.0B | 2.3% |
| Montana | $2.0B | 2.2% |
| Pennsylvania | $2.0B | 2.2% |
| Alabama | $1.9B | 2.1% |
| Colorado | $1.6B | 1.8% |
| New York | $1.6B | 1.7% |
| Tennessee | $1.6B | 1.7% |
| Virginia | $1.6B | 1.7% |
| North Caroline | $1.5B | 1.6% |
| Ohio | $1.4B | 1.5% |
| New Mexico | $1.3B | 1.4% |
| Kansas | $1.2B | 1.3% |
| Indiana | $1.2B | 1.3% |
| Arkansas | $1.0B | 1.1% |
| Wisconsin | $1.0B | 1.1% |
| Illinois | $1.0B | 1.1% |
| Iowa | $0.96B | 1.1% |
| South Carolina | $0.95B | 1.1% |
| Oklahoma | $0.92B | 1.0% |
| Washington | $0.73B | 0.8% |
| Idaho | $0.72B | 0.8% |
| Louisiana | $0.66B | 0.7% |
| Oregon | $0.60B | 0.7% |
| Kentucky | $0.59B | 0.6% |
| South Dakota | $0.50B | 0.5% |
| Maryland | $0.46B | 0.5% |
| New Jersey | $0.40B | 0.4% |
| West Virginia | $0.36B | 0.4% |
| Nebraska | $0.22B | 0.2% |
| Massachusetts | $0.21B | 0.2% |
| Mississippi | $0.20B | 0.2% |
| Connecticut | $0.18B | 0.2% |
| Hawaii | $0.13B | 0.1% |
| Maine | $0.13B | 0.1% |
| Vermont | $0.11B | 0.1% |
| New Hampshire | $0.095B | 0.1% |
| Rhode Island | $0.066B | 0.07% |
| North Dakota | $0.065B | 0.07% |
| Delaware | $0.022B | 0.02% |
| Undistributed | 4.0B | 4.5% |
| Total | $90.4B | 100.0% |
Arizona and Nevada, the top two states, are the country’s biggest producers of copper and gold, respectively. Arizona also produced over $1 billion worth of construction sand and gravel in 2021, in addition to being the country’s leading producer of gemstones.
In third place was Texas, where mines produced nearly $6 billion worth of non-fuel minerals, of which 38% came from crushed stone. California, meanwhile, led in the production of construction sand and gravel, and was the country’s sole source of rare earth elements.
Minnesota also made the top five as the nation’s largest producer of iron ore. In fact, mines in Minnesota and Michigan shipped 98% of domestic usable iron ore products in 2021.
The Missing Critical Minerals
Although the U.S. is a major producer of non-fuel minerals, it still relies on imports for the supply of several minerals.
In 2021, the U.S. imported $5.3 billion worth of raw materials, in addition to $90 billion in net imports of processed mineral materials. Of the 50 minerals deemed critical to national security, the country was 100% net import reliant for 26, including graphite, manganese, and several rare earth metals.
To meet the rising demand for these minerals, U.S. President Biden announced major investments in domestic critical mineral production, including a $35 million grant to MP Materials for the processing of rare earths.
It remains to be seen whether these investments will pay off in building more resilient, end-to-end domestic critical mineral supply chains.


Misc
Brass Rods: The Secure Choice
This graphic shows why brass rods are the secure choice for precision-machined and forged parts.

Brass Rods: The Secure Choice
The unique combination of machinability and recyclability makes brass rods the secure choice for manufacturers seeking future-proof raw material solutions.
This infographic, from the Copper Development Association, shows three ways brass rods give manufacturers greater control and a license to grow in the competitive market for precision-machined and forged products.
Future-Proof Investments in New Machine Tools
A material’s machinability directly impacts machine throughput, which typically has the largest impact on machine shop profitability.
The high-speed machining capabilities of brass rods maximize machine tool performance, allowing manufacturers to run the material faster and longer without sacrificing tool life, chip formation, or surface quality.
The high machining efficiency of brass leads to reduced per-part costs, quicker return on investment (ROI) for new machine tools, and expanded production capacity for new projects.
Supply Security Through Closed Loop Recycling
Brass, like its parent element copper, can be infinitely recycled.
In 2022, brass- and wire-rod mills accounted for the majority of the 830,000 tonnes of copper recycled from scrap in the U.S.
Given that scrap ratios for machined parts typically range from 60-70% by weight, producing mills benefit from a secure and steady supply of clean scrap returned directly from customers, which is recycled to create new brass rods.
The high residual value of brass scrap creates a strong recycling incentive. Scrap buy back programs give manufacturers greater control over raw material net costs as scrap value is often factored into supplier purchase agreements.
Next Generation Alloys for a Lead-Free Future
Increasingly stringent global regulations continue to pressure manufacturers to minimize the use of materials containing trace amounts of lead and other harmful impurities.
The latest generation of brass-rod alloys is engineered to meet the most demanding criteria for lead leaching in drinking water and other sensitive applications.
Seven brass-rod alloys passed rigorous testing to become the only ‘Acceptable Materials’ against lower lead leaching criteria recently adopted in the national U.S. drinking water quality standard, NSF 61.
Learn more about the advantages of brass rods solutions.
Misc
Brass Rods: The Safe Choice
From airbags to firefighting equipment, components made from brass rods play a vital role in creating a safer environment.

Brass Rods: The Safe Choice
From airbags to firefighting equipment, components made from brass rods play a vital role in creating a safer environment.
This infographic from the Copper Development Association illustrates three use cases for brass. This is the first of three infographics in our Choose Brass series.
Why Brass?
Brass is one of the most reliable metals for industrial and other applications. It contains little to no iron, protecting it from oxidation, which can cause other materials to fail over time.
Additionally, the malleability of brass ensures tight and leak-free metal-to-metal seals for threaded joints, minimizing the risk of costly and dangerous system failures. Brass’s durability ensures critical system components function properly for years.
Brass for Safe Water Systems
Exposure to lead in water can cause various health problems, including neurological damage, developmental delays, and cardiovascular diseases.
As a result, the U.S. sets minimum health-effect requirements for chemical contaminants and impurities indirectly transferred to drinking water from products, components, and materials used in water systems.
Currently, only brass rod alloys are designated as “acceptable materials” according to national standards.
Brass is also essential for ensuring workplace safety, particularly in high-risk manufacturing environments.
Using Brass for Safe Manufacturing and Industrial Environments
Brass is used extensively in industrial applications such as machinery components, valves, fittings, architectural elements, bearings, and gears.
The machinability of brass rods also means longer tool life and higher productivity for manufacturers of precision parts.
The microstructure of brass helps break up metal chips generated during machining operations, preventing long and stringy chips that can crash machines and seriously injure operators.
Additionally, brass’s non-sparking properties make it ideal for tooling, fittings, and components in high-risk industries such as oil & gas, chemicals, pharmaceuticals, paint manufacturing, power plants, and explosives.
Brass for Safer Communities
Many pieces of equipment in our daily lives also rely on brass rod parts to function. Control valves in gas stoves, BBQs, and home furnaces made from brass rods reduce the risk of deadly gas leaks and fires.
Moreover, brass is ideal for firefighting equipment due to its corrosion resistance, durability, heat resistance, and non-sparking properties.
Fittings made from brass rods ensure that the brakes and airbags in our vehicles work when needed.
Brass and other copper-based alloys are also naturally antimicrobial, helping prevent diseases when used in high-touch surfaces such as door handles.
These are only some of the ways that brass rods help build a safer world for everyone.
Explore the Advantages of Brass Rod Solutions.

-

 Electrification3 years ago
Ranked: The Top 10 EV Battery Manufacturers
-

 Electrification2 years ago
The Key Minerals in an EV Battery
-

 Real Assets3 years ago
The World’s Top 10 Gold Mining Companies
-

 Misc3 years ago
All the Metals We Mined in One Visualization
-

 Electrification3 years ago
The Biggest Mining Companies in the World in 2021
-

 Energy Shift2 years ago
What Are the Five Major Types of Renewable Energy?
-

 Electrification2 years ago
The World’s Largest Nickel Mining Companies
-

 Electrification2 years ago
Mapped: Solar Power by Country in 2021