

Energy Shift
What Electricity Sources Power the World?
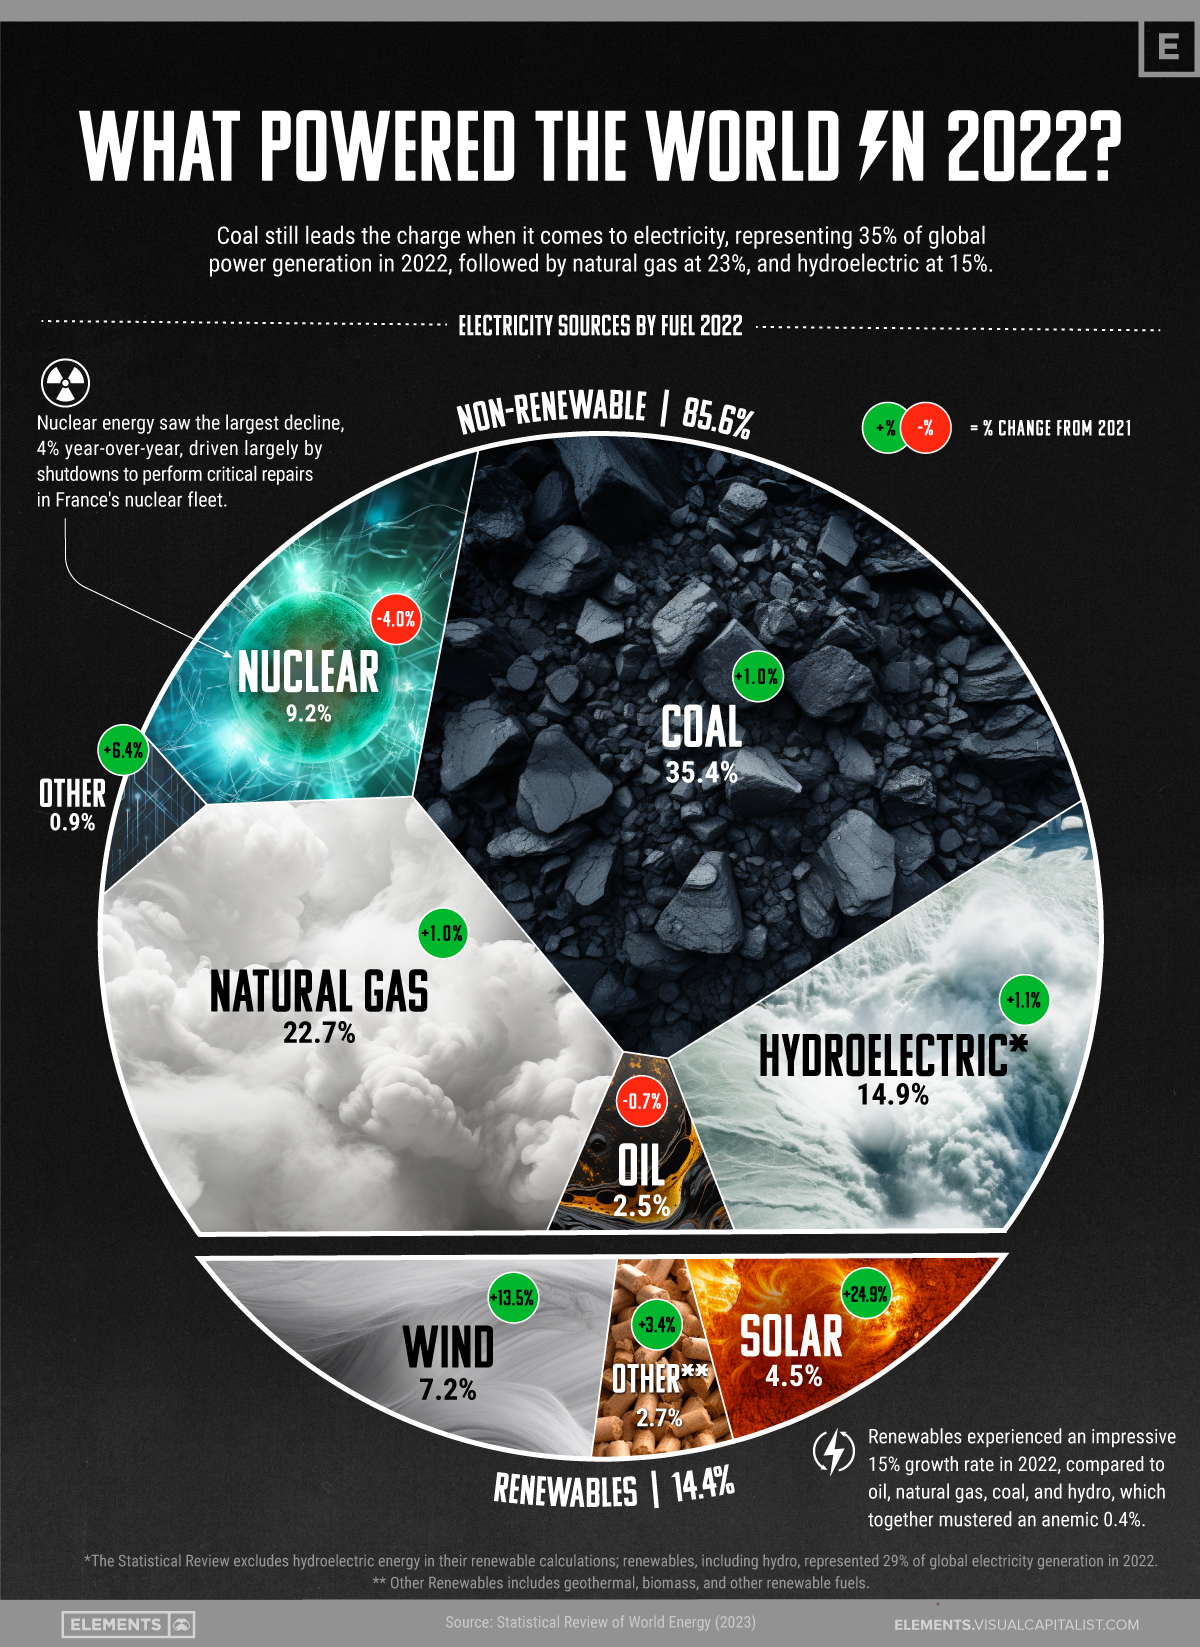
What Powered the World in 2022?
In 2022, 29,165.2 terawatt hours (TWh) of electricity was generated around the world, an increase of 2.3% from the previous year.
In this visualization, we look at data from the latest Statistical Review of World Energy, and ask what powered the world in 2022.
Coal is Still King
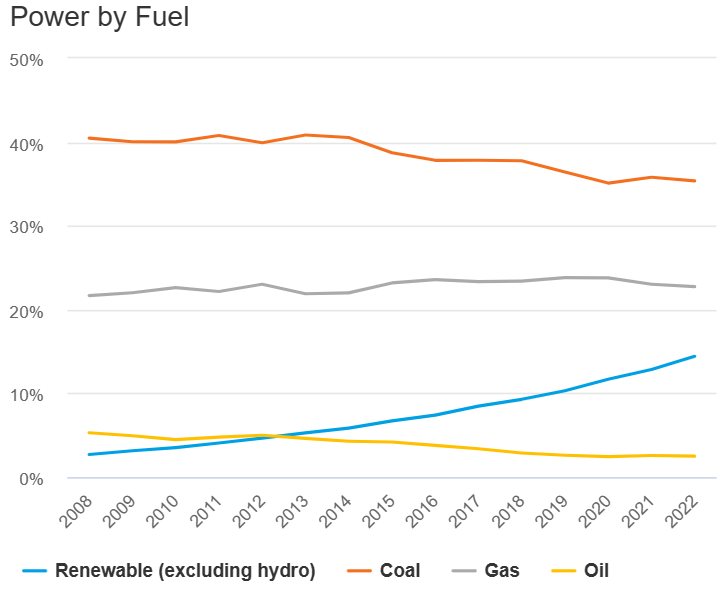
Coal still leads the charge when it comes to electricity, representing 35.4% of global power generation in 2022, followed by natural gas at 22.7%, and hydroelectric at 14.9%.
Source: Energy Institute
Over three-quarters of the world’s total coal-generated electricity is consumed in just three countries. China is the top user of coal, making up 53.3% of global coal demand, followed by India at 13.6%, and the U.S. at 8.9%.
Burning coal—for electricity, as well as metallurgy and cement production—is the world’s single largest source of CO2 emissions. Nevertheless, its use in electricity generation has actually grown 91.2% since 1997, the year when the first global climate agreement was signed in Kyoto, Japan.
Renewables on the Rise
However, even as non-renewables enjoy their time in the sun, their days could be numbered.
In 2022, renewables, such as wind, solar, and geothermal, represented 14.4% of total electricity generation with an extraordinary annual growth rate of 14.7%, driven by big gains in solar and wind. Non-renewables, by contrast, only managed an anemic 0.4%.
The authors of the Statistical Review do not include hydroelectric in their renewable calculations, even though many others, including the International Energy Agency, consider it a “well-established renewable power technology.”
With hydroelectric moved into the renewable column, together they accounted for over 29.3% of all electricity generated in 2022, with an annual growth rate of 7.4%.
France’s Nuclear Horrible Year
Another big mover in this year’s report was nuclear energy.
In addition to disruptions at the Zaporizhzhia nuclear power plant in Ukraine, shutdowns in France’s nuclear fleet to address corrosion found in the safety injection systems of four reactors led to a 4% drop in global use, year-over-year.
The amount of electricity generated by nuclear energy in that country dropped 22% to 294.7 TWh in 2022. As a result, France went from being the world’s biggest exporter of electricity, to a net importer.
Powering the Future
Turning mechanical energy into electrical energy is a relatively straightforward process. Modern power plants are engineering marvels, to be sure, but they still work on the same principle as the very first generator invented by Michael Faraday in 1831.
But how you get the mechanical energy is where things get complicated: coal powered the first industrial revolution, but heated the planet in the process; wind is free and clean, but is unreliable; and nuclear fission reliably generates emission-free electricity, but also creates radioactive waste.
With temperature records being set around the world in the summer, resolving these tensions isn’t just academic and next year’s report could be a crucial test of the world’s commitment to a clean energy future.


Energy Shift
The World’s Biggest Oil Producers in 2023
Just three countries accounted for 40% of global oil production last year.

The World’s Biggest Oil Producers in 2023
This was originally posted on our Voronoi app. Download the app for free on iOS or Android and discover incredible data-driven charts from a variety of trusted sources.
Despite efforts to decarbonize the global economy, oil still remains one of the world’s most important resources. It’s also produced by a fairly limited group of countries, which can be a source of economic and political leverage.
This graphic illustrates global crude oil production in 2023, measured in million barrels per day, sourced from the U.S. Energy Information Administration (EIA).
Three Countries Account for 40% of Global Oil Production
In 2023, the United States, Russia, and Saudi Arabia collectively contributed 32.7 million barrels per day to global oil production.
| Oil Production 2023 | Million barrels per day |
|---|---|
| 🇺🇸 U.S. | 12.9 |
| 🇷🇺 Russia | 10.1 |
| 🇸🇦 Saudi Arabia | 9.7 |
| 🇨🇦 Canada | 4.6 |
| 🇮🇶 Iraq | 4.3 |
| 🇨🇳 China | 4.2 |
| 🇮🇷 Iran | 3.6 |
| 🇧🇷 Brazil | 3.4 |
| 🇦🇪 UAE | 3.4 |
| 🇰🇼 Kuwait | 2.7 |
| 🌍 Other | 22.8 |
These three nations have consistently dominated oil production since 1971. The leading position, however, has alternated among them over the past five decades.
In contrast, the combined production of the next three largest producers—Canada, Iraq, and China—reached 13.1 million barrels per day in 2023, just surpassing the production of the United States alone.
In the near term, no country is likely to surpass the record production achieved by the U.S. in 2023, as no other producer has ever reached a daily capacity of 13.0 million barrels. Recently, Saudi Arabia’s state-owned Saudi Aramco scrapped plans to increase production capacity to 13.0 million barrels per day by 2027.
In 2024, analysts forecast that the U.S. will maintain its position as the top oil producer. In fact, according to Macquarie Group, U.S. oil production is expected to achieve a record pace of about 14 million barrels per day by the end of the year.
Energy Shift
How Much Does the U.S. Depend on Russian Uranium?
Despite a new uranium ban being discussed in Congress, the U.S. is still heavily dependent on Russian uranium.

How Much Does the U.S. Depend on Russian Uranium?
This was originally posted on our Voronoi app. Download the app for free on iOS or Android and discover incredible data-driven charts from a variety of trusted sources.
The U.S. House of Representatives recently passed a ban on imports of Russian uranium. The bill must pass the Senate before becoming law.
In this graphic, we visualize how much the U.S. relies on Russian uranium, based on data from the United States Energy Information Administration (EIA).
U.S. Suppliers of Enriched Uranium
After Russia invaded Ukraine, the U.S. imposed sanctions on Russian-produced oil and gas—yet Russian-enriched uranium is still being imported.
Currently, Russia is the largest foreign supplier of nuclear power fuel to the United States. In 2022, Russia supplied almost a quarter of the enriched uranium used to fuel America’s fleet of more than 90 commercial reactors.
| Country of enrichment service | SWU* | % |
|---|---|---|
| 🇺🇸 United States | 3,876 | 27.34% |
| 🇷🇺 Russia | 3,409 | 24.04% |
| 🇩🇪 Germany | 1,763 | 12.40% |
| 🇬🇧 United Kingdom | 1,593 | 11.23% |
| 🇳🇱 Netherlands | 1,303 | 9.20% |
| Other | 2,232 | 15.79% |
| Total | 14,176 | 100% |
SWU stands for “Separative Work Unit” in the uranium industry. It is a measure of the amount of work required to separate isotopes of uranium during the enrichment process. Source: U.S. Energy Information Administration
Most of the remaining uranium is imported from European countries, while another portion is produced by a British-Dutch-German consortium operating in the United States called Urenco.
Similarly, nearly a dozen countries around the world depend on Russia for more than half of their enriched uranium—and many of them are NATO-allied members and allies of Ukraine.
In 2023 alone, the U.S. nuclear industry paid over $800 million to Russia’s state-owned nuclear energy corporation, Rosatom, and its fuel subsidiaries.
It is important to note that 19% of electricity in the U.S. is powered by nuclear plants.
The dependency on Russian fuels dates back to the 1990s when the United States turned away from its own enrichment capabilities in favor of using down-blended stocks of Soviet-era weapons-grade uranium.
As part of the new uranium-ban bill, the Biden administration plans to allocate $2.2 billion for the expansion of uranium enrichment facilities in the United States.

-

 Electrification3 years ago
Ranked: The Top 10 EV Battery Manufacturers
-

 Electrification2 years ago
The Key Minerals in an EV Battery
-

 Real Assets3 years ago
The World’s Top 10 Gold Mining Companies
-

 Misc3 years ago
All the Metals We Mined in One Visualization
-

 Electrification3 years ago
The Biggest Mining Companies in the World in 2021
-

 Energy Shift2 years ago
What Are the Five Major Types of Renewable Energy?
-

 Electrification2 years ago
Mapped: Solar Power by Country in 2021
-

 Electrification2 years ago
The World’s Largest Nickel Mining Companies