

Energy Shift
How Far Are We From Phasing Out Coal?

How Far Are We from Phasing Out Coal?
At the COP26 conference last year, 40 nations agreed to phase coal out of their energy mixes.
Despite this, in 2021, coal-fired electricity generation reached all-time highs globally, showing that eliminating coal from the energy mix will not be a simple task.
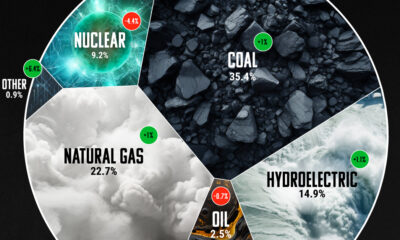
This infographic shows the aggressive phase-out of coal power that would be required in order to reach net zero goals by 2050, based on an analysis by Ember that uses data provided by the International Energy Agency (IEA).
Low-Cost Comes at a High Environmental Cost
Coal-powered electricity generation rose by 9.0% in 2021 to 10,042 Terawatt-hours (TWh), marking the biggest percentage rise since 1985.
The main reason is cost. Coal is the world’s most affordable energy fuel. Unfortunately, low-cost energy comes at a high cost for the environment, with coal being the largest source of energy-related CO2 emissions.
China has the highest coal consumption, making up 54% of the world’s coal electricity generation. The country’s consumption jumped 12% between 2010 and 2020, despite coal making up a lower percentage of the country’s energy mix in relative terms.
| Top Consumers | 2020 Consumption (Exajoules) | Share of global consumption |
|---|---|---|
| China 🇨🇳 | 82.3 | 54.3% |
| India 🇮🇳 | 17.5 | 11.6% |
| United States 🇺🇸 | 9.2 | 6.1% |
| Japan 🇯🇵 | 4.6 | 3.0% |
| South Africa 🇿🇦 | 3.5 | 2.3% |
| Russia 🇷🇺 | 3.3 | 2.2% |
| Indonesia 🇮🇩 | 3.3 | 2.2% |
| South Korea 🇰🇷 | 3.0 | 2.0% |
| Vietnam 🇻🇳 | 2.1 | 1.4% |
| Germany 🇩🇪 | 1.8 | 1.2% |
Together, China and India account for 66% of global coal consumption and emit about 35% of the world’s greenhouse gasses (GHG). If you add the United States to the mix, this goes up to 72% of coal consumption and 49% of GHGs.
How Urgent is to Phase Out Coal?
According to the United Nations, emissions from current and planned fossil energy infrastructure are already more than twice the amount that would push the planet over 1.5°C of global heating, a level that scientists say could bring more intense heat, fire, storms, flooding, and drought than the present 1.2°C.
Apart from being the largest source of CO2 emissions, coal combustion is also a major threat to public health because of the fine particulate matter released into the air.
As just one example of this impact, a recent study from Harvard University estimates air pollution from fossil fuel combustion is responsible for 1 in 5 deaths globally.
The Move to Renewables
Coal-powered electricity generation must fall by 13% every year until 2030 to achieve the Paris Agreement’s goals of keeping global heating to only 1.5 degrees.
To reach the mark, countries would need to speed up the shift from their current carbon-intensive pathways to renewable energy sources like wind and solar.
How fast the transition away from coal will be achieved depends on a complicated balance between carbon emissions cuts and maintaining economic growth, the latter of which is still largely dependent on coal power.


Energy Shift
The World’s Biggest Oil Producers in 2023
Just three countries accounted for 40% of global oil production last year.

The World’s Biggest Oil Producers in 2023
This was originally posted on our Voronoi app. Download the app for free on iOS or Android and discover incredible data-driven charts from a variety of trusted sources.
Despite efforts to decarbonize the global economy, oil still remains one of the world’s most important resources. It’s also produced by a fairly limited group of countries, which can be a source of economic and political leverage.
This graphic illustrates global crude oil production in 2023, measured in million barrels per day, sourced from the U.S. Energy Information Administration (EIA).
Three Countries Account for 40% of Global Oil Production
In 2023, the United States, Russia, and Saudi Arabia collectively contributed 32.7 million barrels per day to global oil production.
| Oil Production 2023 | Million barrels per day |
|---|---|
| 🇺🇸 U.S. | 12.9 |
| 🇷🇺 Russia | 10.1 |
| 🇸🇦 Saudi Arabia | 9.7 |
| 🇨🇦 Canada | 4.6 |
| 🇮🇶 Iraq | 4.3 |
| 🇨🇳 China | 4.2 |
| 🇮🇷 Iran | 3.6 |
| 🇧🇷 Brazil | 3.4 |
| 🇦🇪 UAE | 3.4 |
| 🇰🇼 Kuwait | 2.7 |
| 🌍 Other | 22.8 |
These three nations have consistently dominated oil production since 1971. The leading position, however, has alternated among them over the past five decades.
In contrast, the combined production of the next three largest producers—Canada, Iraq, and China—reached 13.1 million barrels per day in 2023, just surpassing the production of the United States alone.
In the near term, no country is likely to surpass the record production achieved by the U.S. in 2023, as no other producer has ever reached a daily capacity of 13.0 million barrels. Recently, Saudi Arabia’s state-owned Saudi Aramco scrapped plans to increase production capacity to 13.0 million barrels per day by 2027.
In 2024, analysts forecast that the U.S. will maintain its position as the top oil producer. In fact, according to Macquarie Group, U.S. oil production is expected to achieve a record pace of about 14 million barrels per day by the end of the year.
Energy Shift
How Much Does the U.S. Depend on Russian Uranium?
Despite a new uranium ban being discussed in Congress, the U.S. is still heavily dependent on Russian uranium.

How Much Does the U.S. Depend on Russian Uranium?
This was originally posted on our Voronoi app. Download the app for free on iOS or Android and discover incredible data-driven charts from a variety of trusted sources.
The U.S. House of Representatives recently passed a ban on imports of Russian uranium. The bill must pass the Senate before becoming law.
In this graphic, we visualize how much the U.S. relies on Russian uranium, based on data from the United States Energy Information Administration (EIA).
U.S. Suppliers of Enriched Uranium
After Russia invaded Ukraine, the U.S. imposed sanctions on Russian-produced oil and gas—yet Russian-enriched uranium is still being imported.
Currently, Russia is the largest foreign supplier of nuclear power fuel to the United States. In 2022, Russia supplied almost a quarter of the enriched uranium used to fuel America’s fleet of more than 90 commercial reactors.
| Country of enrichment service | SWU* | % |
|---|---|---|
| 🇺🇸 United States | 3,876 | 27.34% |
| 🇷🇺 Russia | 3,409 | 24.04% |
| 🇩🇪 Germany | 1,763 | 12.40% |
| 🇬🇧 United Kingdom | 1,593 | 11.23% |
| 🇳🇱 Netherlands | 1,303 | 9.20% |
| Other | 2,232 | 15.79% |
| Total | 14,176 | 100% |
SWU stands for “Separative Work Unit” in the uranium industry. It is a measure of the amount of work required to separate isotopes of uranium during the enrichment process. Source: U.S. Energy Information Administration
Most of the remaining uranium is imported from European countries, while another portion is produced by a British-Dutch-German consortium operating in the United States called Urenco.
Similarly, nearly a dozen countries around the world depend on Russia for more than half of their enriched uranium—and many of them are NATO-allied members and allies of Ukraine.
In 2023 alone, the U.S. nuclear industry paid over $800 million to Russia’s state-owned nuclear energy corporation, Rosatom, and its fuel subsidiaries.
It is important to note that 19% of electricity in the U.S. is powered by nuclear plants.
The dependency on Russian fuels dates back to the 1990s when the United States turned away from its own enrichment capabilities in favor of using down-blended stocks of Soviet-era weapons-grade uranium.
As part of the new uranium-ban bill, the Biden administration plans to allocate $2.2 billion for the expansion of uranium enrichment facilities in the United States.

-

 Electrification3 years ago
Ranked: The Top 10 EV Battery Manufacturers
-

 Electrification2 years ago
The Key Minerals in an EV Battery
-

 Real Assets3 years ago
The World’s Top 10 Gold Mining Companies
-

 Misc3 years ago
All the Metals We Mined in One Visualization
-

 Electrification3 years ago
The Biggest Mining Companies in the World in 2021
-

 Energy Shift2 years ago
What Are the Five Major Types of Renewable Energy?
-

 Electrification2 years ago
The World’s Largest Nickel Mining Companies
-

 Electrification2 years ago
Mapped: Solar Power by Country in 2021