

Energy Shift
A Lifetime’s Consumption of Fossil Fuels, Visualized
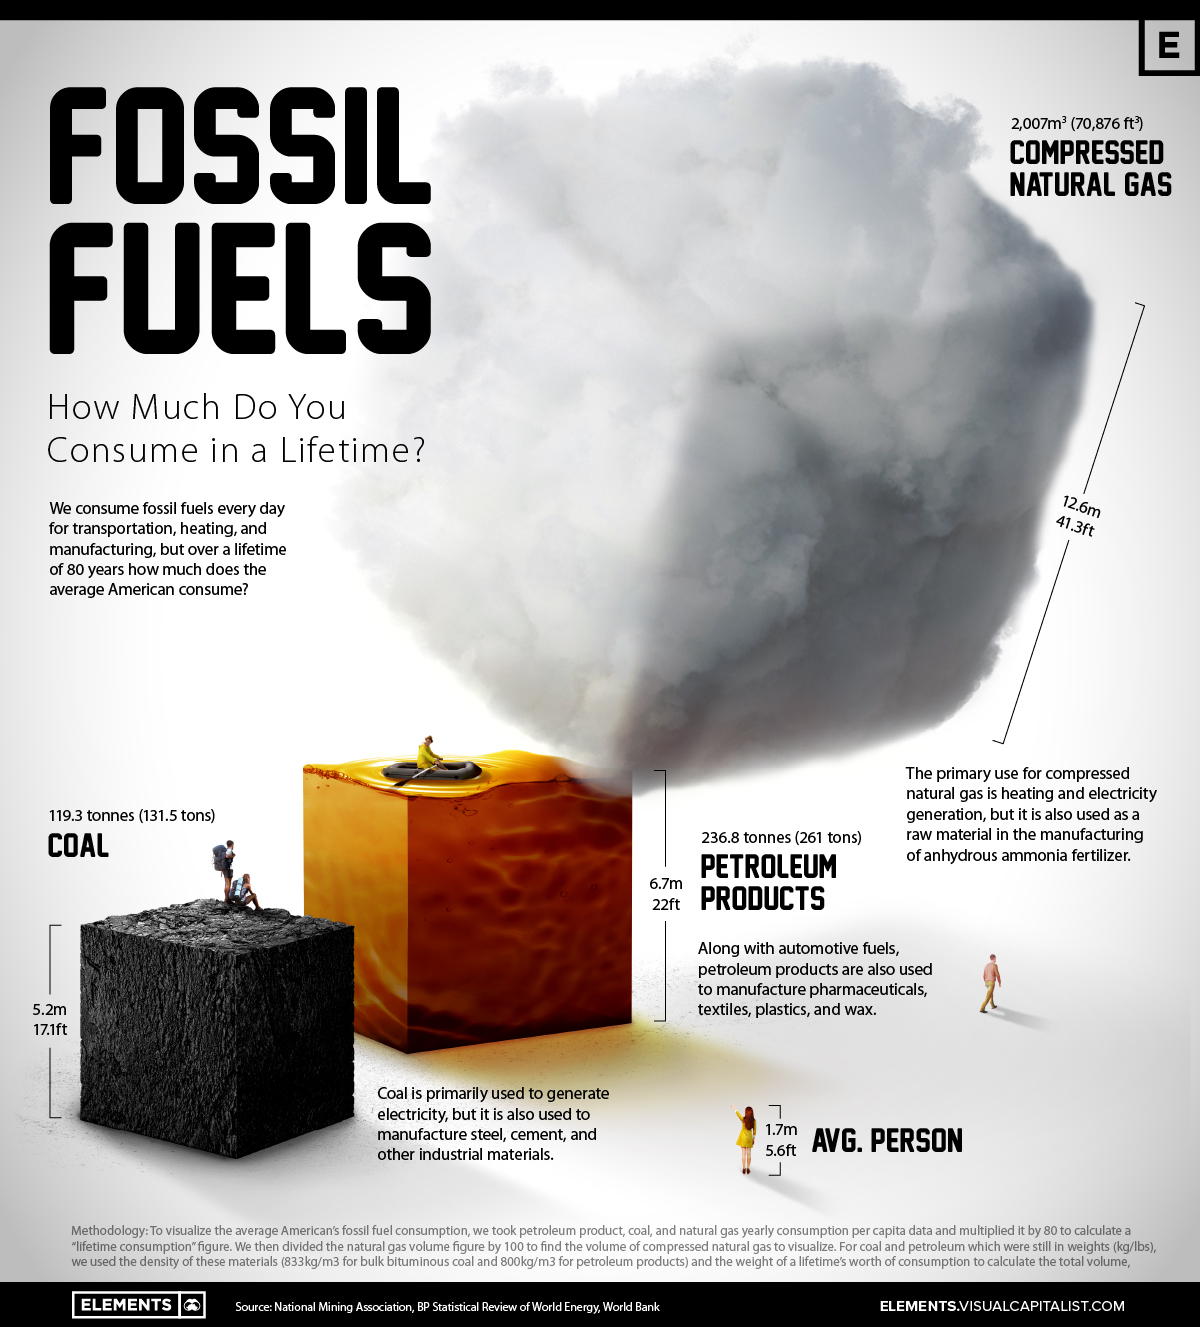


Visualizing the Fossil Fuels we Consume in a Lifetime
From burning natural gas to heat our homes to the petroleum-based materials found in everyday products like pharmaceuticals and plastics, we all consume fossil fuels in one form or another.
In 2021, the world consumed nearly 490 exajoules of fossil fuels, an unfathomable figure of epic proportions.
To put fossil fuel consumption into perspective on a more individual basis, this graphic visualizes the average person’s fossil fuel use over a lifetime of 80 years using data from the National Mining Association and BP’s Statistical Review of World Energy.
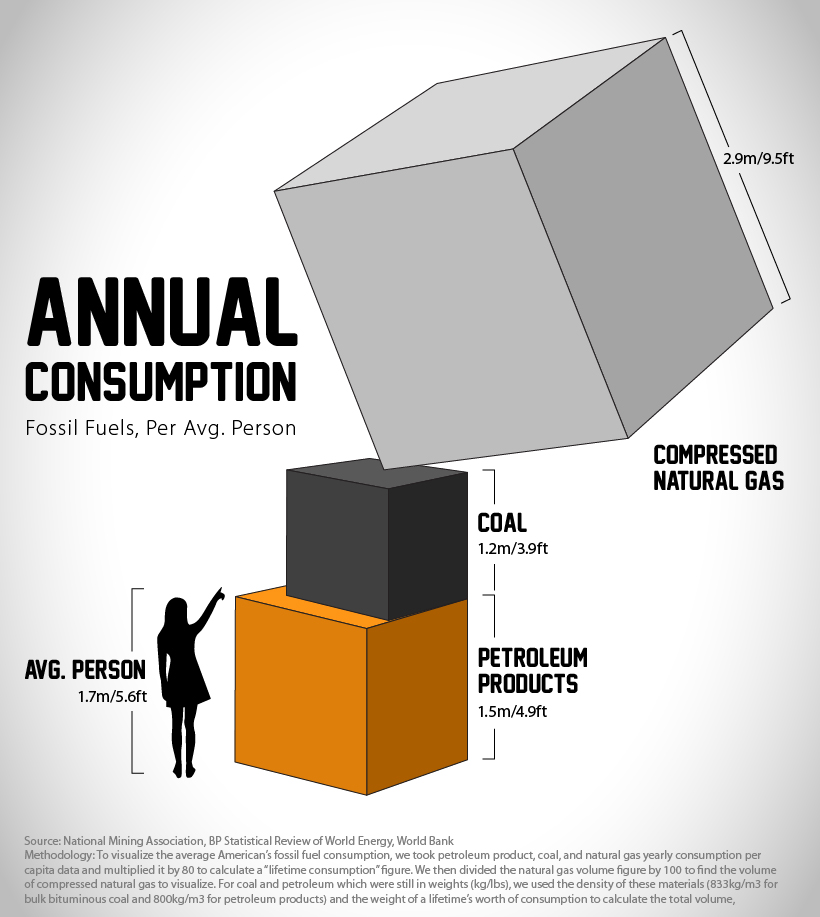
How Many Fossil Fuels a Person Consumes Every Year
On a day-to-day basis, our fossil fuel consumption might seem minimal, however, in just a year the average American consumes more than 23 barrels of petroleum products like gasoline, propane, or jet fuel.
The cube of the average individual’s yearly petroleum product consumption reaches around 1.5 meters (4.9 feet) tall. When you consider varying transportation choices and lifestyles, from public transit to private jets, the yearly cube of petroleum product consumption for some people may easily overtake their height.
To calculate the volume needed to visualize the petroleum products and coal cubes (natural gas figures were already in volume format), we used the densities of bulk bituminous coal (833kg/m3) and petroleum products (800kg/m3) along with the weights of per capita consumption in the U.S. from the National Mining Association.
These figures are averages, and can differ per person depending on a region’s energy mix, transportation choices, and consumption habits, along with other factors.
Global Fossil Fuel Consumption Rebounds Post-Pandemic
When the global economy reopened post-pandemic, energy demand and consumption rebounded past 2019 levels with fossil fuels largely leading the way. While global primary energy demand grew 5.8% in 2021, coal consumption rose by 6% reaching highs not seen since 2014.
In 2021, renewables and hydroelectricity made up nearly 14% of the world’s primary energy use, with fossil fuels (oil, natural gas, and coal) accounting for 82% (down from 83% in 2020), and nuclear energy accounting for the remaining 4%.
Recent demand for fossil fuels has been underpinned by their reliability as generating energy from renewables in Germany has been inconsistent when it’s been needed most.
Now the country grapples with energy rations as it restarts coal-fired power plants in response to its overdependence on Russian fossil fuel energy as the potential permanence of the Nord Stream 1 natural gas pipeline shutdown looms.
Growing Green Energy Amidst Geopolitical Instability
Domestic energy and material supply chain independence quickly became a top priority for many nations amidst Russia’s invasion of Ukraine, Western trade sanctions, and increasingly unpredictable COVID-19 lockdowns in China.
Trade and energy dependence risks still remain a major concern as many nations transition towards renewable energy. For example, essential rare earth mineral production, and solar PV manufacturing supply chains remain dominated by China.
Despite looming storm clouds over global energy and materials trade, renewable energy’s green linings are growing on the global scale. The world’s renewable primary energy consumption reached an annual growth rate of 15%, outgrowing all other energy fuels as wind and solar provided a milestone 10% of global electricity in 2021.
If the global energy mix continues to get greener fast enough, the cubes of our personal fossil fuel consumption may manage to get smaller in the future.


Energy Shift
The World’s Biggest Oil Producers in 2023
Just three countries accounted for 40% of global oil production last year.

The World’s Biggest Oil Producers in 2023
This was originally posted on our Voronoi app. Download the app for free on iOS or Android and discover incredible data-driven charts from a variety of trusted sources.
Despite efforts to decarbonize the global economy, oil still remains one of the world’s most important resources. It’s also produced by a fairly limited group of countries, which can be a source of economic and political leverage.
This graphic illustrates global crude oil production in 2023, measured in million barrels per day, sourced from the U.S. Energy Information Administration (EIA).
Three Countries Account for 40% of Global Oil Production
In 2023, the United States, Russia, and Saudi Arabia collectively contributed 32.7 million barrels per day to global oil production.
| Oil Production 2023 | Million barrels per day |
|---|---|
| 🇺🇸 U.S. | 12.9 |
| 🇷🇺 Russia | 10.1 |
| 🇸🇦 Saudi Arabia | 9.7 |
| 🇨🇦 Canada | 4.6 |
| 🇮🇶 Iraq | 4.3 |
| 🇨🇳 China | 4.2 |
| 🇮🇷 Iran | 3.6 |
| 🇧🇷 Brazil | 3.4 |
| 🇦🇪 UAE | 3.4 |
| 🇰🇼 Kuwait | 2.7 |
| 🌍 Other | 22.8 |
These three nations have consistently dominated oil production since 1971. The leading position, however, has alternated among them over the past five decades.
In contrast, the combined production of the next three largest producers—Canada, Iraq, and China—reached 13.1 million barrels per day in 2023, just surpassing the production of the United States alone.
In the near term, no country is likely to surpass the record production achieved by the U.S. in 2023, as no other producer has ever reached a daily capacity of 13.0 million barrels. Recently, Saudi Arabia’s state-owned Saudi Aramco scrapped plans to increase production capacity to 13.0 million barrels per day by 2027.
In 2024, analysts forecast that the U.S. will maintain its position as the top oil producer. In fact, according to Macquarie Group, U.S. oil production is expected to achieve a record pace of about 14 million barrels per day by the end of the year.
Energy Shift
How Much Does the U.S. Depend on Russian Uranium?
Despite a new uranium ban being discussed in Congress, the U.S. is still heavily dependent on Russian uranium.

How Much Does the U.S. Depend on Russian Uranium?
This was originally posted on our Voronoi app. Download the app for free on iOS or Android and discover incredible data-driven charts from a variety of trusted sources.
The U.S. House of Representatives recently passed a ban on imports of Russian uranium. The bill must pass the Senate before becoming law.
In this graphic, we visualize how much the U.S. relies on Russian uranium, based on data from the United States Energy Information Administration (EIA).
U.S. Suppliers of Enriched Uranium
After Russia invaded Ukraine, the U.S. imposed sanctions on Russian-produced oil and gas—yet Russian-enriched uranium is still being imported.
Currently, Russia is the largest foreign supplier of nuclear power fuel to the United States. In 2022, Russia supplied almost a quarter of the enriched uranium used to fuel America’s fleet of more than 90 commercial reactors.
| Country of enrichment service | SWU* | % |
|---|---|---|
| 🇺🇸 United States | 3,876 | 27.34% |
| 🇷🇺 Russia | 3,409 | 24.04% |
| 🇩🇪 Germany | 1,763 | 12.40% |
| 🇬🇧 United Kingdom | 1,593 | 11.23% |
| 🇳🇱 Netherlands | 1,303 | 9.20% |
| Other | 2,232 | 15.79% |
| Total | 14,176 | 100% |
SWU stands for “Separative Work Unit” in the uranium industry. It is a measure of the amount of work required to separate isotopes of uranium during the enrichment process. Source: U.S. Energy Information Administration
Most of the remaining uranium is imported from European countries, while another portion is produced by a British-Dutch-German consortium operating in the United States called Urenco.
Similarly, nearly a dozen countries around the world depend on Russia for more than half of their enriched uranium—and many of them are NATO-allied members and allies of Ukraine.
In 2023 alone, the U.S. nuclear industry paid over $800 million to Russia’s state-owned nuclear energy corporation, Rosatom, and its fuel subsidiaries.
It is important to note that 19% of electricity in the U.S. is powered by nuclear plants.
The dependency on Russian fuels dates back to the 1990s when the United States turned away from its own enrichment capabilities in favor of using down-blended stocks of Soviet-era weapons-grade uranium.
As part of the new uranium-ban bill, the Biden administration plans to allocate $2.2 billion for the expansion of uranium enrichment facilities in the United States.

-

 Electrification3 years ago
Ranked: The Top 10 EV Battery Manufacturers
-

 Electrification2 years ago
The Key Minerals in an EV Battery
-

 Real Assets2 years ago
The World’s Top 10 Gold Mining Companies
-

 Misc3 years ago
All the Metals We Mined in One Visualization
-

 Electrification3 years ago
The Biggest Mining Companies in the World in 2021
-

 Energy Shift2 years ago
What Are the Five Major Types of Renewable Energy?
-

 Electrification2 years ago
The World’s Largest Nickel Mining Companies
-

 Electrification2 years ago
Mapped: Solar Power by Country in 2021