

Just three countries accounted for 40% of global oil production last year.


Over the last decade, the U.S. has surpassed Saudi Arabia and Russia as the world's top producer of crude oil.
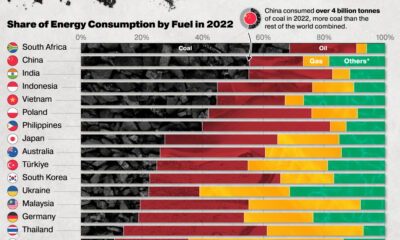

Global consumption of coal surpassed 8 billion tonnes per year for the first time in 2022. Here are the countries using the most coal.
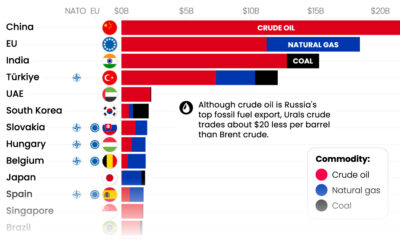

With Russia’s revenues from fossil fuel exports having declined significantly, which countries are still importing Russian fossil fuels?

This infographic puts the oil market's size into perspective by comparing it to the top 10 metal markets.
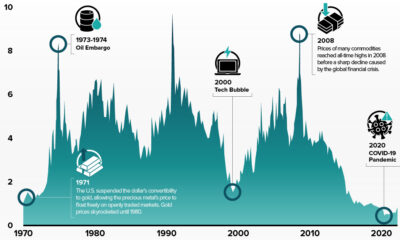

The commodities-to-equities ratio recently hit a 50-year low. In the past, when this ratio reached such levels, commodity supercycles began.


While Russia still makes billions from fossil fuel exports, revenues are declining. Here are the largest importers since the start of the invasion.


How much oil, coal, and natural gas do we extract each year? See the scale of annual fossil fuel production in perspective.
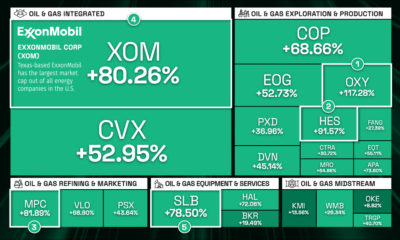

The energy sector outperformed the broader U.S. market in 2022 for the second straight year. Which companies came out on top?
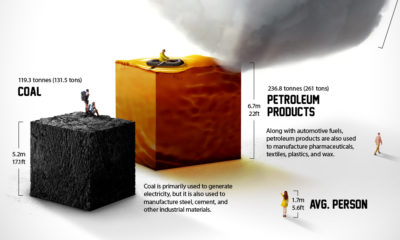

Each year the average American consumes more than 23 barrels of petroleum products. What does a lifetime of fossil fuel consumption look like?