

Over the last decade, the U.S. has surpassed Saudi Arabia and Russia as the world's top producer of crude oil.
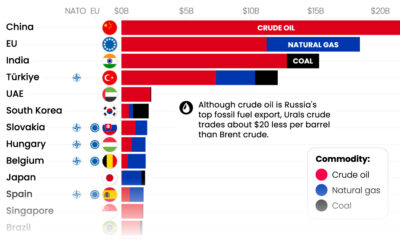

With Russia’s revenues from fossil fuel exports having declined significantly, which countries are still importing Russian fossil fuels?
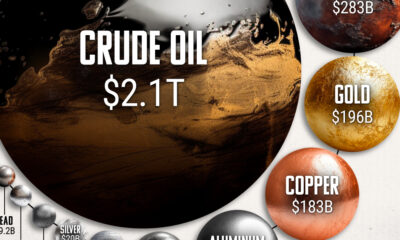

This infographic puts the oil market's size into perspective by comparing it to the top 10 metal markets.


While Russia still makes billions from fossil fuel exports, revenues are declining. Here are the largest importers since the start of the invasion.
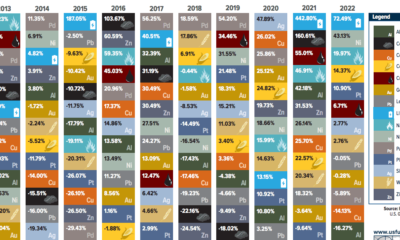

This table shows the fluctuating returns for various commodities over the past decade, from energy fuels to industrial and precious metals.
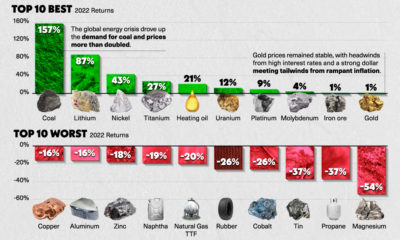

The year 2022 was full of volatility for commodity prices. This infographic charts the top 10 best and worst commodities by returns in 2022.
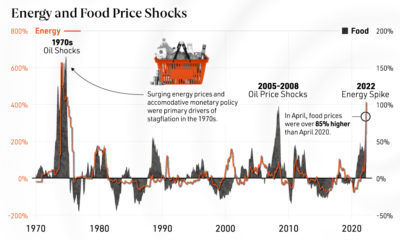

From rising inflation to food insecurity, we show why energy price shocks have far-reaching effects on the global economy.
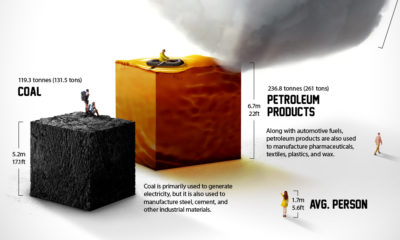

Each year the average American consumes more than 23 barrels of petroleum products. What does a lifetime of fossil fuel consumption look like?
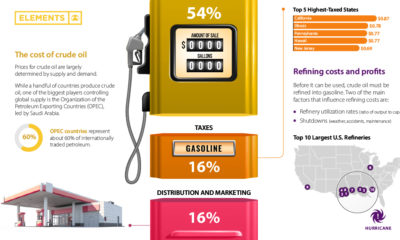

To help understand what’s happening at the pump, it’s important to first know what key factors dictate the price of gas.
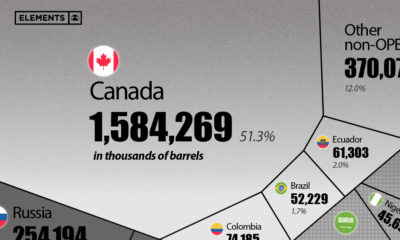

This visualization breaks down the countries from which the U.S. imported its crude oil and petroleum products in 2021.