

Energy Shift
70 Years of Global Uranium Production by Country
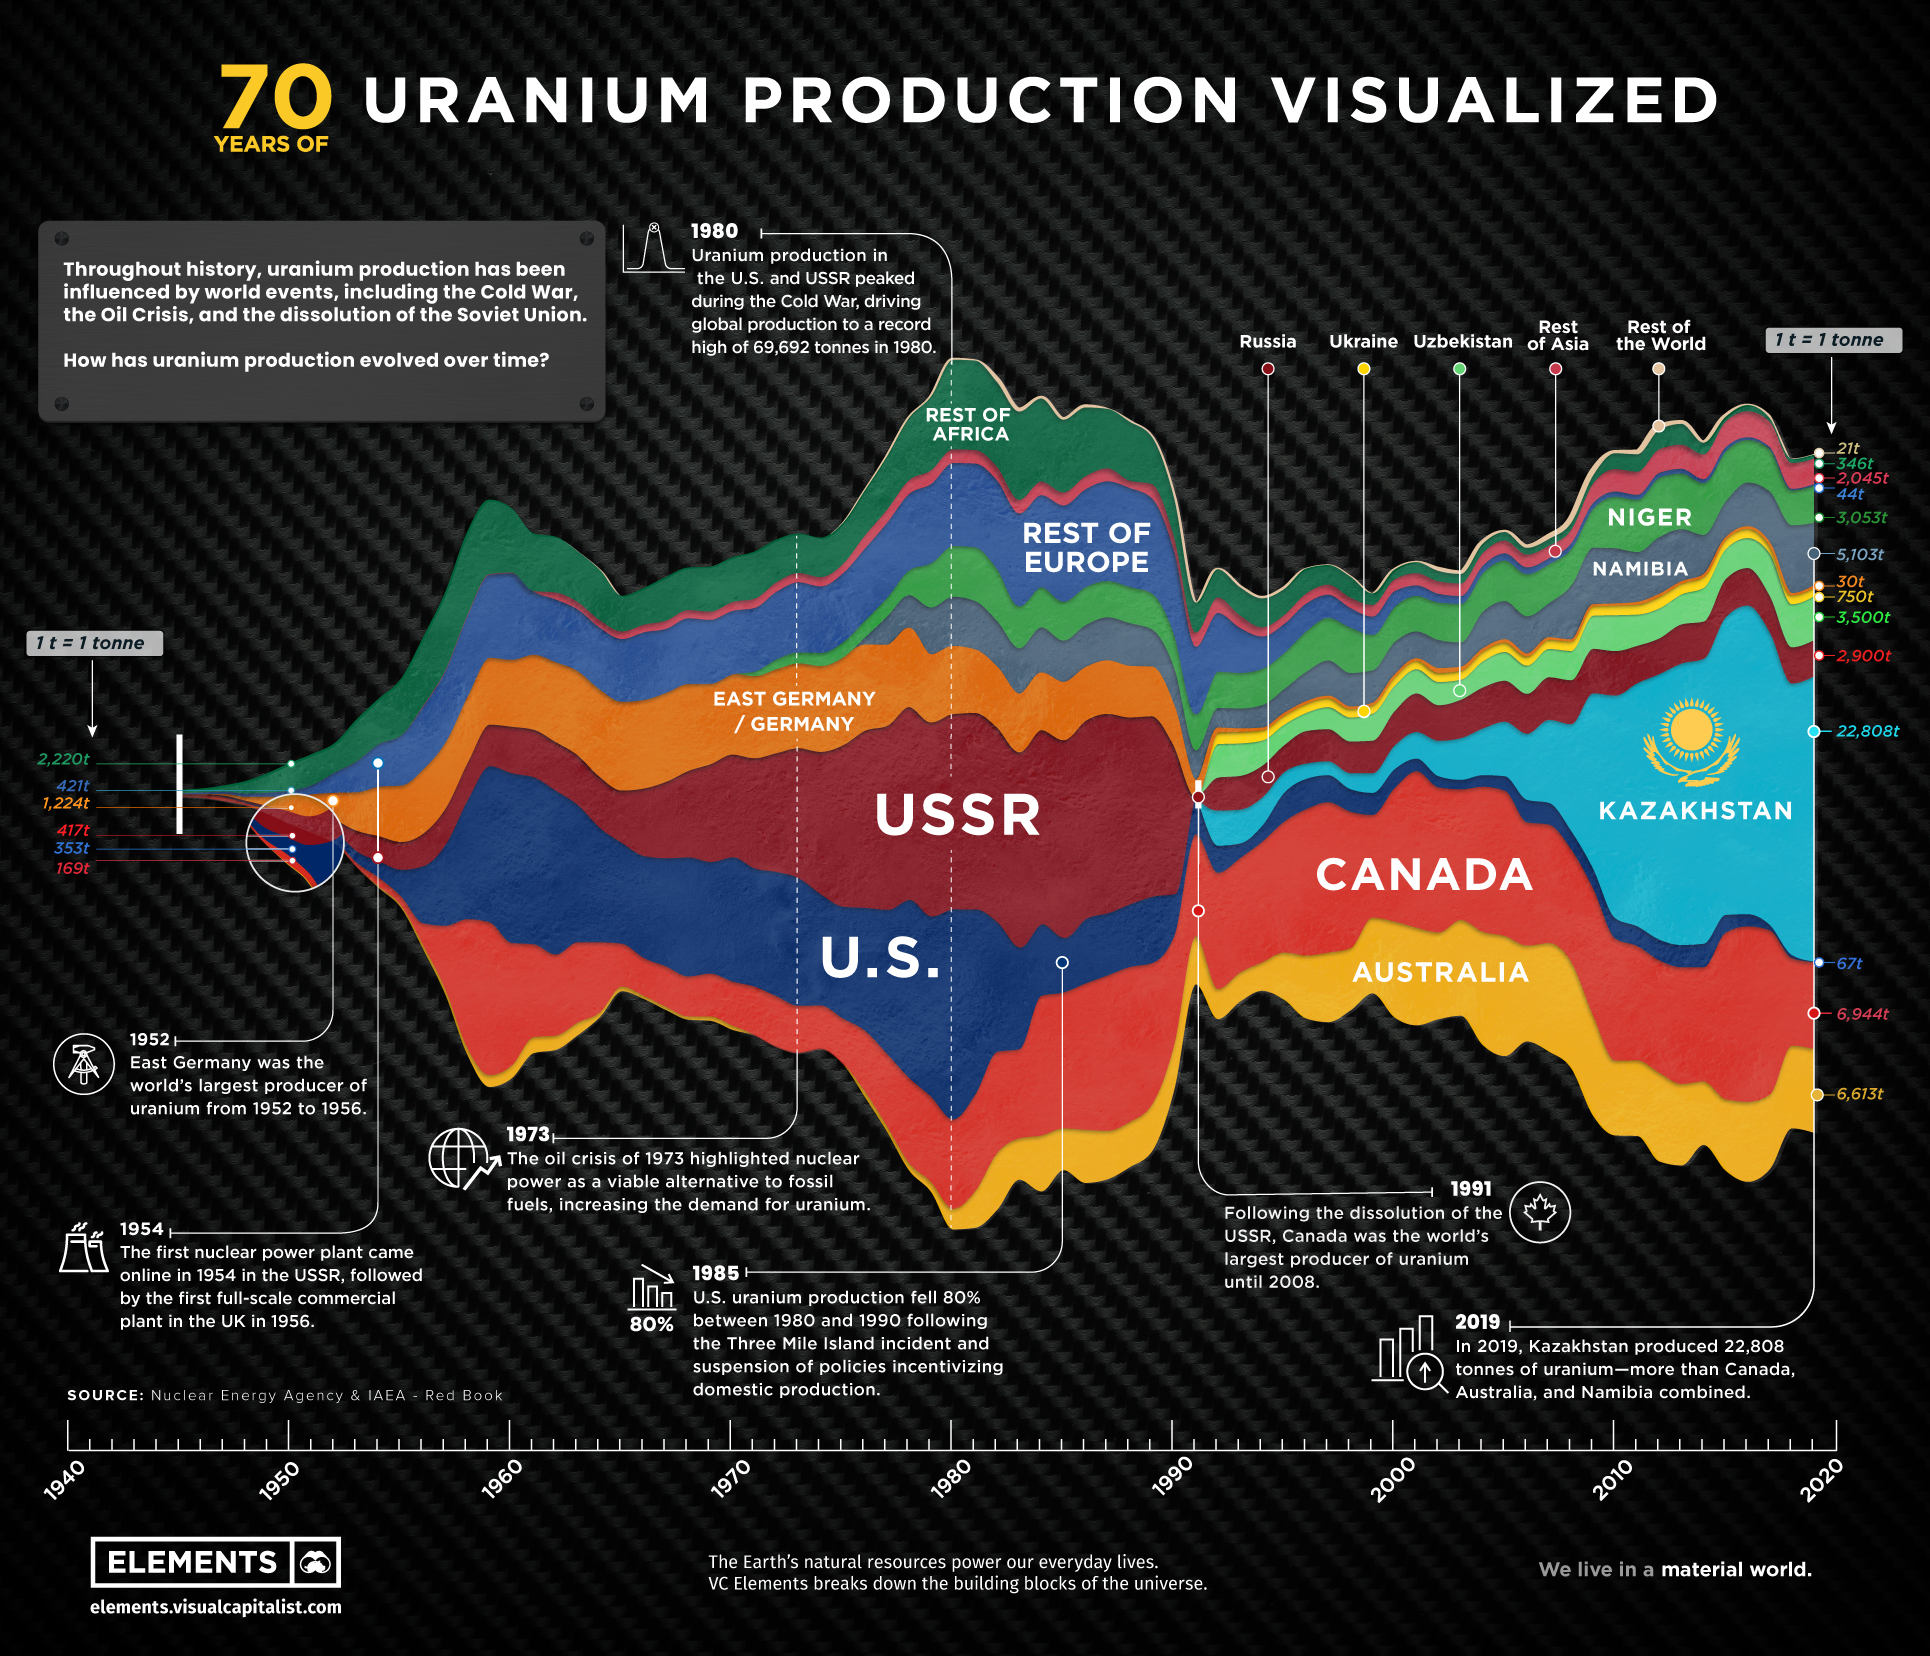
70 Years of Global Uranium Production by Country
Uranium was discovered just over 200 years ago in 1789, and today, it’s among the world’s most important energy minerals.
Throughout history, several events have left their imprints on global uranium production, from the invention of nuclear energy to the stockpiling of weapons during the Cold War.
The above infographic visualizes over 70 years of uranium production by country using data from the Nuclear Energy Agency.
The Pre-nuclear Power Era
The first commercial nuclear power plant came online in 1956. Before that, uranium production was mainly dedicated to satisfying military requirements.
In the 1940s, most of the world’s uranium came from the Shinkolobwe Mine in the Belgian Congo. During this time, Shinkolobwe and Canada’s Eldorado Mine also supplied uranium for the Manhattan Project and the world’s first atomic bomb.
However, the end of World War II marked the beginning of two events that changed the uranium industry—the Cold War and the advent of nuclear energy.
Peak Uranium
Between 1960 and 1980, global uranium production increased by 53% to reach an all-time high of 69,692 tonnes. Here’s a breakdown of the top uranium producers in 1980:
| Country | 1980 Production (tonnes U) | % of Total |
|---|---|---|
| U.S. 🇺🇸 | 16,811 | 24% |
| USSR | 15,700 | 23% |
| Canada 🇨🇦 | 7,150 | 10% |
| South Africa 🇿🇦 | 6,146 | 9% |
| East Germany 🇩🇪 | 5,245 | 8% |
| Niger 🇳🇪 | 4,120 | 6% |
| Namibia 🇳🇦 | 4,042 | 6% |
| France 🇫🇷 | 2,634 | 4% |
| Czechoslovakia 🇨🇿 | 2,482 | 4% |
| Australia 🇦🇺 | 1,561 | 2% |
| Other 🌎 | 3,801 | 5% |
| Total | 69,692 | 100% |
Several factors drove this rise in production, including the heat of the Cold War and the rising demand for nuclear power. For example, the U.S. had 5,543 nuclear warheads in 1957. 10 years later, it had over 31,000, and the USSR eventually surpassed this with a peak stockpile of around 40,000 warheads by 1986.
Additionally, the increasing number of reactors worldwide also propelled uranium production to new highs. In 1960, 15 reactors were operating globally. By 1980, this number increased to 245. What’s more, after the Oil Crisis in 1973, nuclear power emerged as a viable alternative to fossil fuels, and the price of uranium tripled between 1973 and 1975. Although the increase in uranium production was less dramatic, high prices made mining more profitable.
However, several nuclear accidents in the world such as the Three Mile Island reactor meltdown in the U.S. in 1979 and the Chernobyl disaster in Ukraine in 1986 brought a stop to the rapid growth of nuclear power. Furthermore, following the end of the Cold War, military stockpiles of uranium were used as “secondary supply”, reducing the need for mine production to some extent. As a result, uranium production declined sharply after 1987.
The Current State of Uranium Mining
Uranium producers have changed considerably over time. Since the economic viability of uranium deposits often depends on the market price, many countries have dropped out due to lower uranium prices, while others have entered the mix.
Here are the top 10 uranium-producing countries based on 2019 production:
| Country | 2019 Production (tonnes U) | % of Total |
|---|---|---|
| Kazakhstan 🇰🇿 | 22,808 | 42% |
| Canada 🇨🇦 | 6,944 | 13% |
| Australia 🇦🇺 | 6,613 | 12% |
| Namibia 🇳🇦 | 5,103 | 9% |
| Uzbekistan 🇺🇿 | 3,500 | 6% |
| Niger 🇳🇪 | 3,053 | 6% |
| Russia 🇷🇺 | 2,900 | 5% |
| China 🇨🇳 | 1,600 | 3% |
| Ukraine 🇺🇦 | 750 | 1% |
| India 🇮🇳 | 400 | 1% |
| Other 🌎 | 553 | 1% |
| Total | 54,224 | 100% |
Kazakhstan has been the world’s leading uranium producer since 2009. In 2019, Kazakhstan mined more uranium than Canada, Australia, and Namibia combined, making up 42% of global production. It’s also worth noting that Kazakhstan, Uzbekistan, Russia, and Ukraine—four countries that were formerly part of the USSR—made it into the top 10 list.
Canada was the world’s second-largest producer of uranium despite production cuts at the country’s biggest uranium mines. Australia ranked third with just three uranium-producing mines including Olympic Dam, the world’s largest known uranium deposit.
Overall, the top 10 countries accounted for 99% of global uranium production, and the majority of this came from the top three. However, global production has been on a downward trend since 2016, with a slight bump in 2019.
The Future of Uranium Production: Up or Down?
The uranium market is at an inflection point, with tightening supply and rising demand.
As of 2020, mine production covered only 74% of world reactor requirements, and analysts expect the market deficit to continue through 2022. Although secondary sources have historically filled the gap between demand and supply, recent developments in the uranium market have driven prices to six-year highs, which could also affect uranium production.
In addition, the shift towards clean energy could provide a boost to uranium demand, especially because of the advantages of nuclear power. With countries like China embracing nuclear energy and others planning for complete phase-outs, nuclear’s evolving role in the global energy mix will likely shape the future of uranium production.


Energy Shift
The World’s Biggest Oil Producers in 2023
Just three countries accounted for 40% of global oil production last year.

The World’s Biggest Oil Producers in 2023
This was originally posted on our Voronoi app. Download the app for free on iOS or Android and discover incredible data-driven charts from a variety of trusted sources.
Despite efforts to decarbonize the global economy, oil still remains one of the world’s most important resources. It’s also produced by a fairly limited group of countries, which can be a source of economic and political leverage.
This graphic illustrates global crude oil production in 2023, measured in million barrels per day, sourced from the U.S. Energy Information Administration (EIA).
Three Countries Account for 40% of Global Oil Production
In 2023, the United States, Russia, and Saudi Arabia collectively contributed 32.7 million barrels per day to global oil production.
| Oil Production 2023 | Million barrels per day |
|---|---|
| 🇺🇸 U.S. | 12.9 |
| 🇷🇺 Russia | 10.1 |
| 🇸🇦 Saudi Arabia | 9.7 |
| 🇨🇦 Canada | 4.6 |
| 🇮🇶 Iraq | 4.3 |
| 🇨🇳 China | 4.2 |
| 🇮🇷 Iran | 3.6 |
| 🇧🇷 Brazil | 3.4 |
| 🇦🇪 UAE | 3.4 |
| 🇰🇼 Kuwait | 2.7 |
| 🌍 Other | 22.8 |
These three nations have consistently dominated oil production since 1971. The leading position, however, has alternated among them over the past five decades.
In contrast, the combined production of the next three largest producers—Canada, Iraq, and China—reached 13.1 million barrels per day in 2023, just surpassing the production of the United States alone.
In the near term, no country is likely to surpass the record production achieved by the U.S. in 2023, as no other producer has ever reached a daily capacity of 13.0 million barrels. Recently, Saudi Arabia’s state-owned Saudi Aramco scrapped plans to increase production capacity to 13.0 million barrels per day by 2027.
In 2024, analysts forecast that the U.S. will maintain its position as the top oil producer. In fact, according to Macquarie Group, U.S. oil production is expected to achieve a record pace of about 14 million barrels per day by the end of the year.
Energy Shift
How Much Does the U.S. Depend on Russian Uranium?
Despite a new uranium ban being discussed in Congress, the U.S. is still heavily dependent on Russian uranium.

How Much Does the U.S. Depend on Russian Uranium?
This was originally posted on our Voronoi app. Download the app for free on iOS or Android and discover incredible data-driven charts from a variety of trusted sources.
The U.S. House of Representatives recently passed a ban on imports of Russian uranium. The bill must pass the Senate before becoming law.
In this graphic, we visualize how much the U.S. relies on Russian uranium, based on data from the United States Energy Information Administration (EIA).
U.S. Suppliers of Enriched Uranium
After Russia invaded Ukraine, the U.S. imposed sanctions on Russian-produced oil and gas—yet Russian-enriched uranium is still being imported.
Currently, Russia is the largest foreign supplier of nuclear power fuel to the United States. In 2022, Russia supplied almost a quarter of the enriched uranium used to fuel America’s fleet of more than 90 commercial reactors.
| Country of enrichment service | SWU* | % |
|---|---|---|
| 🇺🇸 United States | 3,876 | 27.34% |
| 🇷🇺 Russia | 3,409 | 24.04% |
| 🇩🇪 Germany | 1,763 | 12.40% |
| 🇬🇧 United Kingdom | 1,593 | 11.23% |
| 🇳🇱 Netherlands | 1,303 | 9.20% |
| Other | 2,232 | 15.79% |
| Total | 14,176 | 100% |
SWU stands for “Separative Work Unit” in the uranium industry. It is a measure of the amount of work required to separate isotopes of uranium during the enrichment process. Source: U.S. Energy Information Administration
Most of the remaining uranium is imported from European countries, while another portion is produced by a British-Dutch-German consortium operating in the United States called Urenco.
Similarly, nearly a dozen countries around the world depend on Russia for more than half of their enriched uranium—and many of them are NATO-allied members and allies of Ukraine.
In 2023 alone, the U.S. nuclear industry paid over $800 million to Russia’s state-owned nuclear energy corporation, Rosatom, and its fuel subsidiaries.
It is important to note that 19% of electricity in the U.S. is powered by nuclear plants.
The dependency on Russian fuels dates back to the 1990s when the United States turned away from its own enrichment capabilities in favor of using down-blended stocks of Soviet-era weapons-grade uranium.
As part of the new uranium-ban bill, the Biden administration plans to allocate $2.2 billion for the expansion of uranium enrichment facilities in the United States.

-

 Electrification3 years ago
Ranked: The Top 10 EV Battery Manufacturers
-

 Electrification2 years ago
The Key Minerals in an EV Battery
-

 Real Assets3 years ago
The World’s Top 10 Gold Mining Companies
-

 Misc3 years ago
All the Metals We Mined in One Visualization
-

 Electrification3 years ago
The Biggest Mining Companies in the World in 2021
-

 Energy Shift2 years ago
What Are the Five Major Types of Renewable Energy?
-

 Electrification2 years ago
Mapped: Solar Power by Country in 2021
-

 Electrification2 years ago
The World’s Largest Nickel Mining Companies