

Electrification
Visualizing China’s Evolving Energy Mix
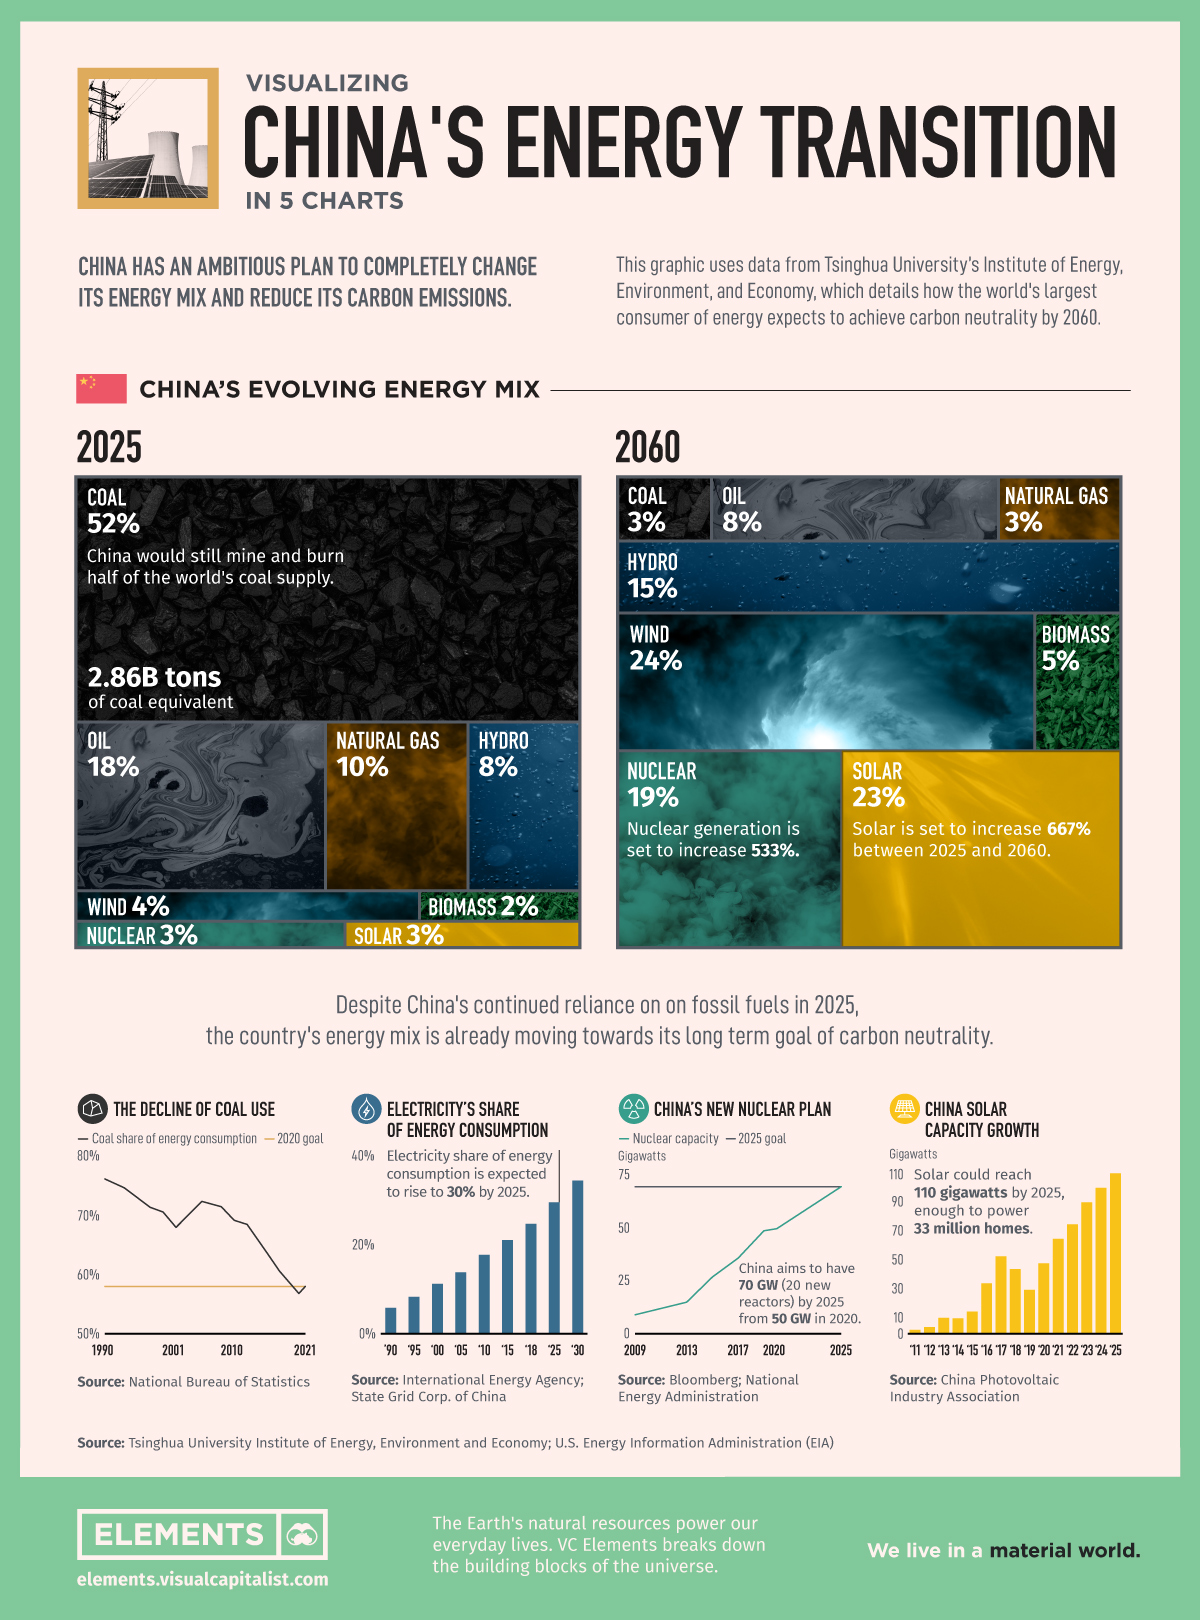
Visualizing China’s Energy Transition in 5 Charts
In September 2020, China’s President Xi Jinping announced the steps his nation would take to reach carbon neutrality by 2060 via videolink before the United Nations Assembly in New York.
This infographic takes a look at what this ambitious plan for China’s energy would look like and what efforts are underway towards this goal.
China’s Ambitious Plan
A carbon-neutral China requires changing the entire economy over the next 40 years, a change the IEA compares to the ambition of the reforms that industrialized the country’s economy in the first place.
China is the world’s largest consumer of electricity, well ahead of the second place consumer, the United States. Currently, 80% of China’s energy comes from fossil fuels, but this plan envisions only 14% coming from coal, oil, and natural gas in 2060.
| Energy Source | 2025 | 2060 | % Change |
|---|---|---|---|
| Coal | 52% | 3% | -94% |
| Oil | 18% | 8% | -56% |
| Natural Gas | 10% | 3% | -70% |
| Wind | 4% | 24% | +500% |
| Nuclear | 3% | 19% | +533% |
| Biomass | 2% | 5% | +150% |
| Solar | 3% | 23% | +667% |
| Hydro | 8% | 15% | +88% |
Source: Tsinghua University Institute of Energy, Environment and Economy; U.S. EIA
According to the Carbon Brief, China’s 14th five-year plan appears to enshrine Xi’s goal. This plan outlines a general and non specific list of projects for a new energy system. It includes the construction of eight large-scale clean energy centers, coastal nuclear power, electricity transmission routes, power system flexibility, oil-and-gas transportation, and storage capacity.
Progress Towards Renewables?
While the goal seems far off in the future, China is on a trajectory towards reducing the carbon emissions of its electricity grid with declining coal usage, increased nuclear, and increased solar power capacity.
According to ChinaPower, coal fueled the rise of China with the country using 144 million tonnes of oil equivalent “Mtoe” in 1965, peaking at 1,969 Mtoe in 2013. However, its share as part of the country’s total energy mix has been declining since the 1990s from ~77% to just under ~60%.
Another trend in China’s energy transition will be the greater consumption of energy as electricity. As China urbanized, its cities expanded creating greater demand for electricity in homes, businesses, and everyday life. This trend is set to continue and approach 40% of total energy consumed by 2030 up from ~5% in 1990.
Under the new plan, by 2060, China is set to have 42% of its energy coming from solar and nuclear while in 2025 it is only expected to be 6%. China has been adding nuclear and solar capacity and expects to add the equivalent of 20 new reactors by 2025 and enough solar power for 33 million homes (110GW).
Changing the energy mix away from fossil fuels, while ushering in a new economic model is no small task.
Up to the Task?
China is the world’s factory and has relatively young industrial infrastructure with fleets of coal plants, steel mills, and cement factories with plenty of life left.
However, China also is the biggest investor in low-carbon energy sources, has access to massive technological talent, and holds a strong central government to guide the transition.
The direction China takes will have the greatest impact on the health of the planet and provide guidance for other countries looking to change their energy mixes, for better or for worse.
The world is watching…even if it’s by videolink.


Electrification
Ranked: The Top 10 EV Battery Manufacturers in 2023
Asia dominates this ranking of the world’s largest EV battery manufacturers in 2023.

The Top 10 EV Battery Manufacturers in 2023
This was originally posted on our Voronoi app. Download the app for free on iOS or Android and discover incredible data-driven charts from a variety of trusted sources.
Despite efforts from the U.S. and EU to secure local domestic supply, all major EV battery manufacturers remain based in Asia.
In this graphic we rank the top 10 EV battery manufacturers by total battery deployment (measured in megawatt-hours) in 2023. The data is from EV Volumes.
Chinese Dominance
Contemporary Amperex Technology Co. Limited (CATL) has swiftly risen in less than a decade to claim the title of the largest global battery group.
The Chinese company now has a 34% share of the market and supplies batteries to a range of made-in-China vehicles, including the Tesla Model Y, SAIC’s MG4/Mulan, and Li Auto models.
| Company | Country | 2023 Production (megawatt-hour) | Share of Total Production |
|---|---|---|---|
| CATL | 🇨🇳China | 242,700 | 34% |
| BYD | 🇨🇳China | 115,917 | 16% |
| LG Energy Solution | 🇰🇷Korea | 108,487 | 15% |
| Panasonic | 🇯🇵Japan | 56,560 | 8% |
| SK On | 🇰🇷Korea | 40,711 | 6% |
| Samsung SDI | 🇰🇷Korea | 35,703 | 5% |
| CALB | 🇨🇳China | 23,493 | 3% |
| Farasis Energy | 🇨🇳China | 16,527 | 2% |
| Envision AESC | 🇨🇳China | 8,342 | 1% |
| Sunwoda | 🇨🇳China | 6,979 | 1% |
| Other | - | 56,040 | 8% |
In 2023, BYD surpassed LG Energy Solution to claim second place. This was driven by demand from its own models and growth in third-party deals, including providing batteries for the made-in-Germany Tesla Model Y, Toyota bZ3, Changan UNI-V, Venucia V-Online, as well as several Haval and FAW models.
The top three battery makers (CATL, BYD, LG) collectively account for two-thirds (66%) of total battery deployment.
Once a leader in the EV battery business, Panasonic now holds the fourth position with an 8% market share, down from 9% last year. With its main client, Tesla, now effectively sourcing batteries from multiple suppliers, the Japanese battery maker seems to be losing its competitive edge in the industry.
Overall, the global EV battery market size is projected to grow from $49 billion in 2022 to $98 billion by 2029, according to Fortune Business Insights.
Electrification
White Gold: Mapping U.S. Lithium Mines
In this graphic, Visual Capitalist partnerered with EnergyX to explore the size and location of U.S. lithium mines.

White Gold: Mapping U.S. Lithium Mines
The U.S. doubled imports of lithium-ion batteries for the third consecutive year in 2022, and with EV demand growing yearly, U.S. lithium mines must ramp up production or rely on other nations for their supply of refined lithium.
To determine if the domestic U.S. lithium opportunity can meet demand, we partnered with EnergyX to determine how much lithium sits within U.S. borders.
U.S. Lithium Projects
The most crucial measure of a lithium mine’s potential is the quantity that can be extracted from the source.
For each lithium resource, the potential volume of lithium carbonate equivalent (LCE) was calculated with a ratio of one metric ton of lithium producing 5.32 metric tons of LCE. Cumulatively, existing U.S. lithium projects contain 94.8 million metric tons of LCE.
| Rank | Project Name | LCE, million metric tons (est.) |
|---|---|---|
| 1 | McDermitt Caldera | 21.5 |
| 2 | Thacker Pass | 19.1 |
| 3 | Tonopah Flats | 18.0 |
| 4 | TLC Lithium | 10.7 |
| 5 | Clayton Valley (Century Lithium) | 6.3 |
| 6 | Zeus Lithium | 6.3 |
| 7 | Rhyolite Ridge | 3.4 |
| 8 | Arkansas Smackover (Phase 1A) | 2.8 |
| 9 | Basin Project | 2.2 |
| 10 | McGee Deposit | 2.1 |
| 11 | Arkansas Smackover (South West) | 1.8 |
| 12 | Clayton Valley (Lithium-X, Pure Energy) | 0.8 |
| 13 | Big Sandy | 0.3 |
| 14 | Imperial Valley/Salton Sea | 0.3 |
U.S. Lithium Opportunities, By State
U.S. lithium projects mainly exist in western states, with comparatively minor opportunities in central or eastern states.
| State | LCE, million metric tons (est.) |
|---|---|
| Nevada | 88.2 |
| Arkansas | 4.6 |
| Arizona | 2.5 |
| California | 0.3 |
Currently, the U.S. is sitting on a wealth of lithium that it is underutilizing. For context, in 2022, the U.S. only produced about 5,000 metric tons of LCE and imported a projected 19,000 metric tons of LCE, showing that the demand for the mineral is healthy.
The Next Gold Rush?
U.S. lithium companies have the opportunity to become global leaders in lithium production and accelerate the transition to sustainable energy sources. This is particularly important as the demand for lithium is increasing every year.
EnergyX is on a mission to meet U.S. lithium demands using groundbreaking technology that can extract 300% more lithium from a source than traditional methods.
You can take advantage of this opportunity by investing in EnergyX and joining other significant players like GM in becoming a shareholder.


-

 Electrification3 years ago
Ranked: The Top 10 EV Battery Manufacturers
-

 Electrification2 years ago
The Key Minerals in an EV Battery
-

 Real Assets3 years ago
The World’s Top 10 Gold Mining Companies
-

 Misc3 years ago
All the Metals We Mined in One Visualization
-

 Electrification3 years ago
The Biggest Mining Companies in the World in 2021
-

 Energy Shift2 years ago
What Are the Five Major Types of Renewable Energy?
-

 Electrification2 years ago
Mapped: Solar Power by Country in 2021
-

 Electrification2 years ago
The World’s Largest Nickel Mining Companies