

Electrification
Are Copper Prices in a Supercycle? A 120-Year Perspective
Are Copper Prices in a Supercycle? A 120-Year Perspective
There are multiple factors that could fuel the price of copper to record highs, including the global recovery from the COVID-19 pandemic, the U.S. trillion-dollar stimulus package, and the ongoing energy transition.
As a result of this, some global banks are predicting a supercycle for the metal, i.e., a sustained spell of abnormally strong demand growth that producers struggle to match, sparking a rally in prices that can last decades.
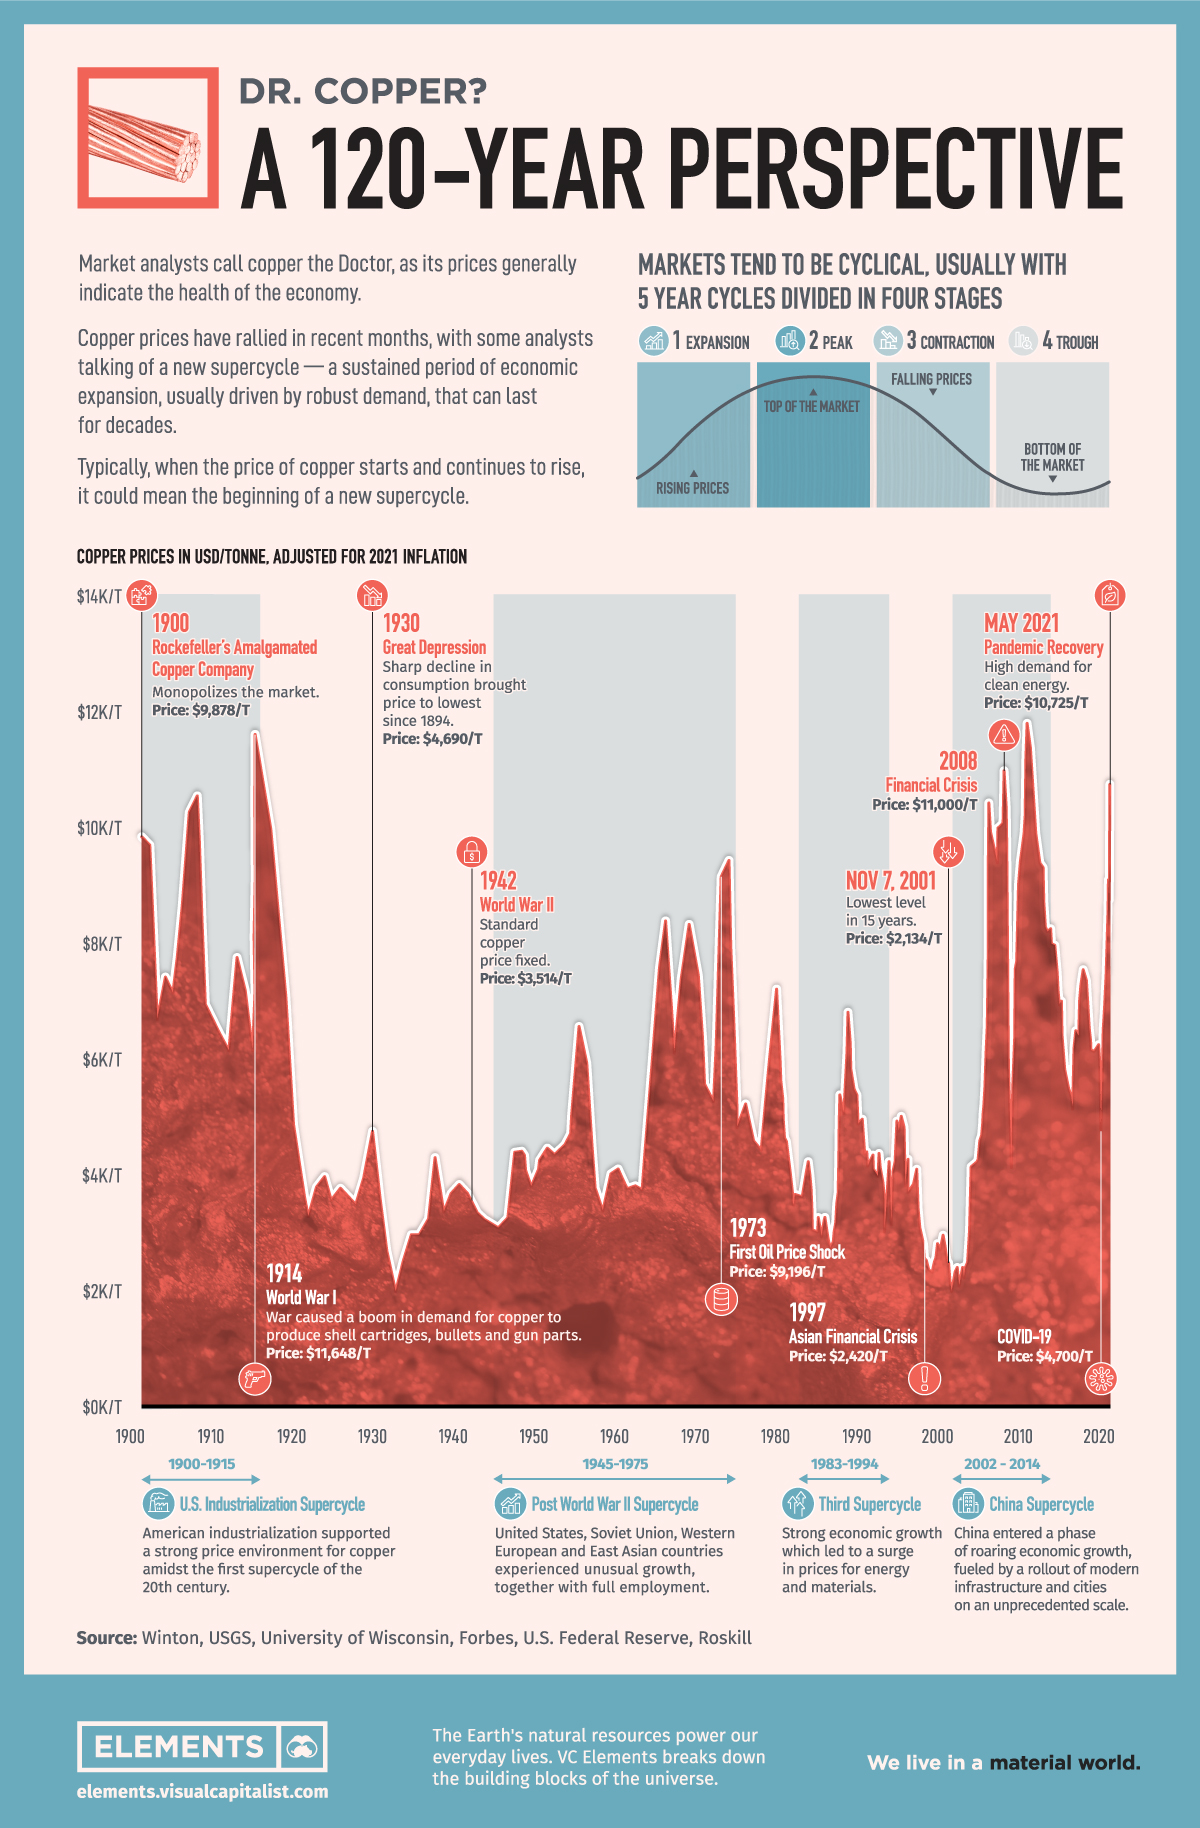
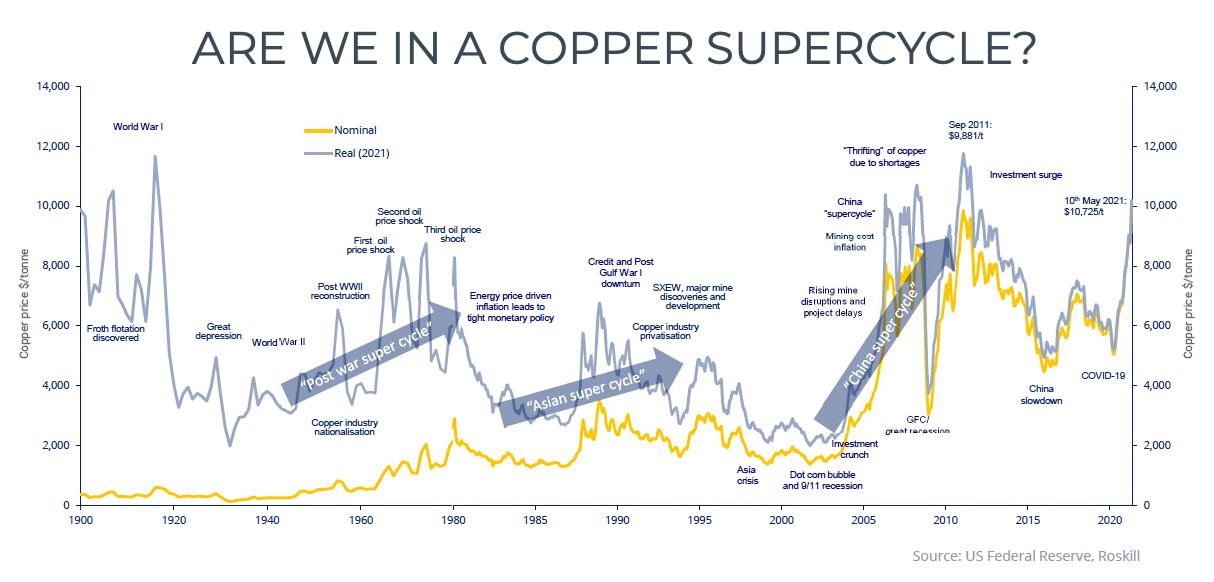
To put the current trend into perspective, the above graphic uses data from the U.S. Federal Reserve and consultancy Roskill to picture copper’s previous rallies over the last 120 years.
| Historic Events | Price In USD/Tonne |
|---|---|
| 1914 - World War I | $11,648 |
| 1930 - Great Depression | $4,690 |
| 1942 - World War II | $3,514 |
| 1973 - Oil Crisis | $9,196 |
| 1997 - Asian Crisis | $2,420 |
| 2008 - Financial Crisis | $11,000 |
| 2020 - COVID-19 | $4,700 |
The Rise of a Super Power: U.S. Supercycle
Industrialization and urbanization in the United States sparked the first supercycle of the 20th century. Machines replaced hand labor as the main means of manufacturing and people moved to cities in record numbers. Immigration and natural growth caused the U.S. population to rise from 40 million in 1870 to 100 million in 1916.
“What’s right about America is that although we have a mess of problems, we have great capacity – intellect and resources – to do some thing about them.” – Henry Ford II
The value of goods produced in the U.S. increased almost tenfold between 1870 and 1916. The cycle was succeeded by the Great Depression, with a sharp decline in world consumption that brought the copper price to the lowest since 1894 ($4,690 per tonne).
Pax Americana: The Post-War Copper Supercycle
During WWII, the U.S. government considered copper a critical metal to the military. In order to conserve copper supply, the use of copper in building construction was prohibited, specific products with copper were limited to 60% of its previous war usage, and the War Production Board allocated supply to specific manufacturers.
At the center of global copper markets, the London Metals Exchange fixed the price of copper at £56/tonne ($3,514 per tonne, adjusted to 2021 inflation) during the war and the government issued permits to control purchases. The official price would rise after the war due to increased demand from reconstruction and the rise of the automobile, but price controls were not lifted until 1953.
The United States, Soviet Union, Western European, and East Asian countries experienced unusual growth after World War II. The reconstruction of Europe and Japan powered the commodities market and despite the scale of material damage, industrial equipment and plants survived the war remarkably intact.
“I was very lucky, I was part of the post-war period when everything had to be redone.” – Pierre Cardin
The outbreak of the Korean War in 1950 further strengthened demand as countries commenced strategic stockpiling programs. In January 1951, the US government imposed a ceiling price of 24.6¢/lb on domestic copper which remained in place until the end of 1952. Price controls held U.S. domestic prices lower than world prices, creating shortages.
According to assets managing firm Winton, U.S. prices remained lower after the release of these controls, as producers sought to prevent the substitution of copper wiring with cheaper materials such as aluminum. This two-tier market – producer prices for U.S. consumers and LME prices for everyone else – was in place until 1970.
The Pax Americana spanned from the end of the Second World War in 1945 to the early 1970s, when the collapse of the Bretton Woods monetary system and the 1973 oil crisis caused high unemployment and high inflation in most of the Western world. Prices jumped to $9,196 per tonne in 1973.
The Four Tigers and The Rise of China: Asian Supercycles
The massive growth of East Asia nations drove the next two supercycles of the century: (1983-1994) and the 2000s commodities boom (2002-2014).
Specifically, Japan played a central role in the third supercycle of the century. The country achieved record economic growth, averaging 10% a year until the seventies. Its economy grew from one less productive than Italy to the third-largest in the world, behind only the United States and the Soviet Union. Growth was especially strong in heavy industry and in advanced technology.
The most recent cycle started in 2002 after China joined the World Trade Organization (WTO) and started to modernize its economy. The country entered a phase of roaring economic growth, fueled by a rollout of infrastructure and cities on an unprecedented scale. Copper price reached $9,000 per tonne in May 2006, pressured by strong Chinese demand.
Are Copper Prices in a Supercycle?
Previous copper rallies reveal a pattern of broad-based growth, industrialization, and new technologies can help drive the demand and prices. Is the global economy entering such a phase?
As world economies emerge from the COVID-19 pandemic and decarbonization is top-of-mind in many countries, copper is set to play a key role as an electrical conductor. Electric and hybrid cars use more copper than regular gasoline vehicles – 165lbs, 110lbs and 55lbs respectively. Renewables also demand more copper: A single wind farm can contain between 4 million and 15 million pounds of metal.
The copper price hit a record high in May 2021 ($10,476 a tonne) and trading house Trafigura Group, Goldman Sachs, and Bank of America expect the metal to extend its recent gains. Whether it will be enough for a new supercycle is yet to be seen.
Hindsight is 20/20 but the future looks electric.


Electrification
Ranked: The Top 10 EV Battery Manufacturers in 2023
Asia dominates this ranking of the world’s largest EV battery manufacturers in 2023.

The Top 10 EV Battery Manufacturers in 2023
This was originally posted on our Voronoi app. Download the app for free on iOS or Android and discover incredible data-driven charts from a variety of trusted sources.
Despite efforts from the U.S. and EU to secure local domestic supply, all major EV battery manufacturers remain based in Asia.
In this graphic we rank the top 10 EV battery manufacturers by total battery deployment (measured in megawatt-hours) in 2023. The data is from EV Volumes.
Chinese Dominance
Contemporary Amperex Technology Co. Limited (CATL) has swiftly risen in less than a decade to claim the title of the largest global battery group.
The Chinese company now has a 34% share of the market and supplies batteries to a range of made-in-China vehicles, including the Tesla Model Y, SAIC’s MG4/Mulan, and Li Auto models.
| Company | Country | 2023 Production (megawatt-hour) | Share of Total Production |
|---|---|---|---|
| CATL | 🇨🇳China | 242,700 | 34% |
| BYD | 🇨🇳China | 115,917 | 16% |
| LG Energy Solution | 🇰🇷Korea | 108,487 | 15% |
| Panasonic | 🇯🇵Japan | 56,560 | 8% |
| SK On | 🇰🇷Korea | 40,711 | 6% |
| Samsung SDI | 🇰🇷Korea | 35,703 | 5% |
| CALB | 🇨🇳China | 23,493 | 3% |
| Farasis Energy | 🇨🇳China | 16,527 | 2% |
| Envision AESC | 🇨🇳China | 8,342 | 1% |
| Sunwoda | 🇨🇳China | 6,979 | 1% |
| Other | - | 56,040 | 8% |
In 2023, BYD surpassed LG Energy Solution to claim second place. This was driven by demand from its own models and growth in third-party deals, including providing batteries for the made-in-Germany Tesla Model Y, Toyota bZ3, Changan UNI-V, Venucia V-Online, as well as several Haval and FAW models.
The top three battery makers (CATL, BYD, LG) collectively account for two-thirds (66%) of total battery deployment.
Once a leader in the EV battery business, Panasonic now holds the fourth position with an 8% market share, down from 9% last year. With its main client, Tesla, now effectively sourcing batteries from multiple suppliers, the Japanese battery maker seems to be losing its competitive edge in the industry.
Overall, the global EV battery market size is projected to grow from $49 billion in 2022 to $98 billion by 2029, according to Fortune Business Insights.
Electrification
White Gold: Mapping U.S. Lithium Mines
In this graphic, Visual Capitalist partnerered with EnergyX to explore the size and location of U.S. lithium mines.

White Gold: Mapping U.S. Lithium Mines
The U.S. doubled imports of lithium-ion batteries for the third consecutive year in 2022, and with EV demand growing yearly, U.S. lithium mines must ramp up production or rely on other nations for their supply of refined lithium.
To determine if the domestic U.S. lithium opportunity can meet demand, we partnered with EnergyX to determine how much lithium sits within U.S. borders.
U.S. Lithium Projects
The most crucial measure of a lithium mine’s potential is the quantity that can be extracted from the source.
For each lithium resource, the potential volume of lithium carbonate equivalent (LCE) was calculated with a ratio of one metric ton of lithium producing 5.32 metric tons of LCE. Cumulatively, existing U.S. lithium projects contain 94.8 million metric tons of LCE.
| Rank | Project Name | LCE, million metric tons (est.) |
|---|---|---|
| 1 | McDermitt Caldera | 21.5 |
| 2 | Thacker Pass | 19.1 |
| 3 | Tonopah Flats | 18.0 |
| 4 | TLC Lithium | 10.7 |
| 5 | Clayton Valley (Century Lithium) | 6.3 |
| 6 | Zeus Lithium | 6.3 |
| 7 | Rhyolite Ridge | 3.4 |
| 8 | Arkansas Smackover (Phase 1A) | 2.8 |
| 9 | Basin Project | 2.2 |
| 10 | McGee Deposit | 2.1 |
| 11 | Arkansas Smackover (South West) | 1.8 |
| 12 | Clayton Valley (Lithium-X, Pure Energy) | 0.8 |
| 13 | Big Sandy | 0.3 |
| 14 | Imperial Valley/Salton Sea | 0.3 |
U.S. Lithium Opportunities, By State
U.S. lithium projects mainly exist in western states, with comparatively minor opportunities in central or eastern states.
| State | LCE, million metric tons (est.) |
|---|---|
| Nevada | 88.2 |
| Arkansas | 4.6 |
| Arizona | 2.5 |
| California | 0.3 |
Currently, the U.S. is sitting on a wealth of lithium that it is underutilizing. For context, in 2022, the U.S. only produced about 5,000 metric tons of LCE and imported a projected 19,000 metric tons of LCE, showing that the demand for the mineral is healthy.
The Next Gold Rush?
U.S. lithium companies have the opportunity to become global leaders in lithium production and accelerate the transition to sustainable energy sources. This is particularly important as the demand for lithium is increasing every year.
EnergyX is on a mission to meet U.S. lithium demands using groundbreaking technology that can extract 300% more lithium from a source than traditional methods.
You can take advantage of this opportunity by investing in EnergyX and joining other significant players like GM in becoming a shareholder.


-

 Electrification3 years ago
Ranked: The Top 10 EV Battery Manufacturers
-

 Electrification2 years ago
The Key Minerals in an EV Battery
-

 Real Assets3 years ago
The World’s Top 10 Gold Mining Companies
-

 Misc3 years ago
All the Metals We Mined in One Visualization
-

 Electrification3 years ago
The Biggest Mining Companies in the World in 2021
-

 Energy Shift2 years ago
What Are the Five Major Types of Renewable Energy?
-

 Electrification2 years ago
Mapped: Solar Power by Country in 2021
-

 Electrification2 years ago
The World’s Largest Nickel Mining Companies