

Electrification
Life Cycle Emissions: EVs vs. Combustion Engine Vehicles
Life Cycle Emissions: EVs vs. Combustion Engine Vehicles
According to the International Energy Agency, the transportation sector is more reliant on fossil fuels than any other sector in the economy. In 2021, it accounted for 37% of all CO2 emissions from end‐use sectors.
To gain insights into how different vehicle types contribute to these emissions, the above graphic visualizes the life cycle emissions of battery electric, hybrid, and internal combustion engine (ICE) vehicles using Polestar and Rivian’s Pathway Report.
Production to Disposal: Emissions at Each Stage
Life cycle emissions are the total amount of greenhouse gases emitted throughout a product’s existence, including its production, use, and disposal.
To compare these emissions effectively, a standardized unit called metric tons of CO2 equivalent (tCO2e) is used, which accounts for different types of greenhouse gases and their global warming potential.
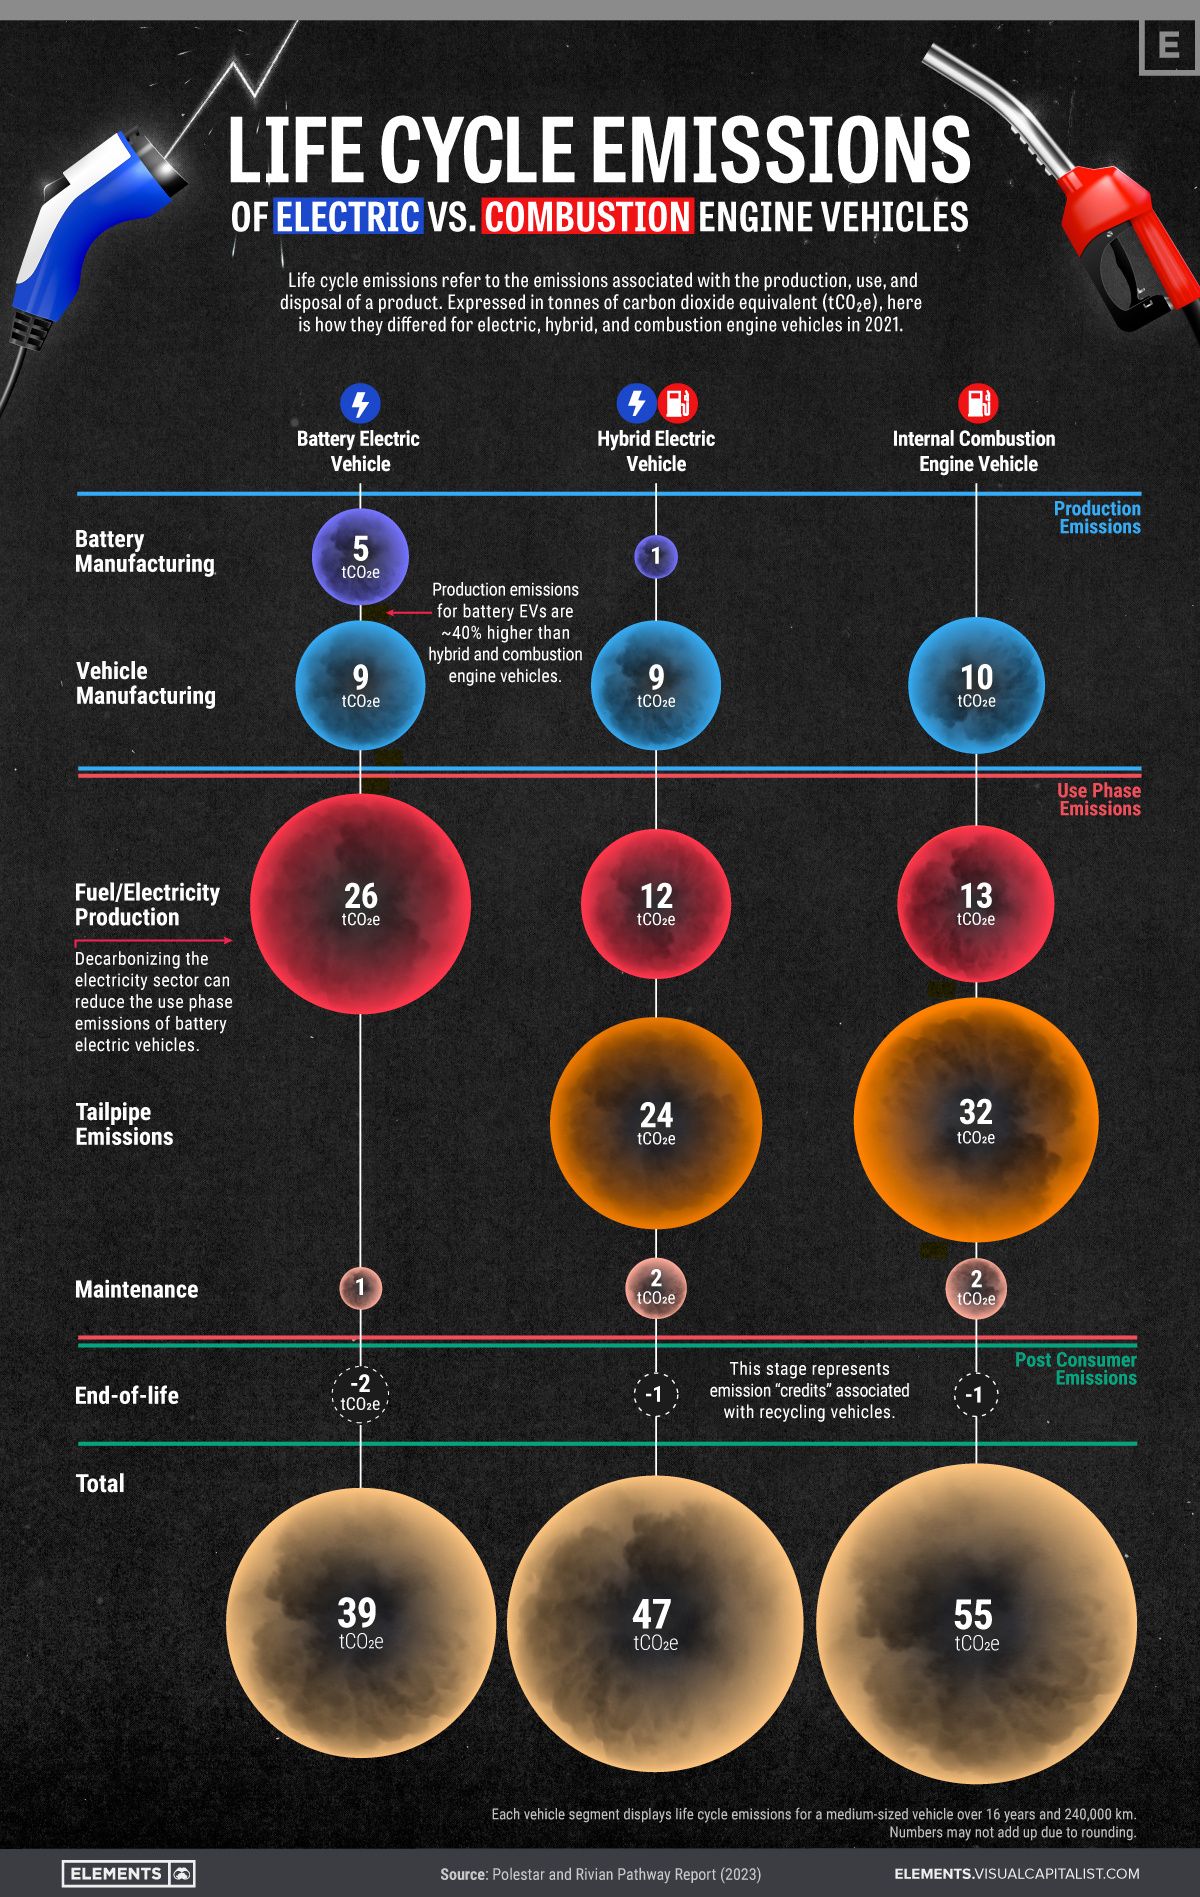
Here is an overview of the 2021 life cycle emissions of medium-sized electric, hybrid and ICE vehicles in each stage of their life cycles, using tCO2e. These numbers consider a use phase of 16 years and a distance of 240,000 km.
| Battery electric vehicle | Hybrid electric vehicle | Internal combustion engine vehicle | ||
|---|---|---|---|---|
| Production emissions (tCO2e) | Battery manufacturing | 5 | 1 | 0 |
| Vehicle manufacturing | 9 | 9 | 10 | |
| Use phase emissions (tCO2e) | Fuel/electricity production | 26 | 12 | 13 |
| Tailpipe emissions | 0 | 24 | 32 | |
| Maintenance | 1 | 2 | 2 | |
| Post consumer emissions (tCO2e) | End-of-life | -2 | -1 | -1 |
| TOTAL | 39 tCO2e | 47 tCO2e | 55 tCO2e |
While it may not be surprising that battery electric vehicles (BEVs) have the lowest life cycle emissions of the three vehicle segments, we can also take some other insights from the data that may not be as obvious at first.
- The production emissions for BEVs are approximately 40% higher than those of hybrid and ICE vehicles. According to a McKinsey & Company study, this high emission intensity can be attributed to the extraction and refining of raw materials like lithium, cobalt, and nickel that are needed for batteries, as well as the energy-intensive manufacturing process of BEVs.
- Electricity production is by far the most emission-intensive stage in a BEVs life cycle. Decarbonizing the electricity sector by implementing renewable and nuclear energy sources can significantly reduce these vehicles’ use phase emissions.
- By recycling materials and components in their end-of-life stages, all vehicle segments can offset a portion of their earlier life cycle emissions.
Accelerating the Transition to Electric Mobility
As we move toward a carbon-neutral economy, battery electric vehicles can play an important role in reducing global CO2 emissions.
Despite their lack of tailpipe emissions, however, it’s good to note that many stages of a BEV’s life cycle are still quite emission-intensive, specifically when it comes to manufacturing and electricity production.
Advancing the sustainability of battery production and fostering the adoption of clean energy sources can, therefore, aid in lowering the emissions of BEVs even further, leading to increased environmental stewardship in the transportation sector.


Electrification
Ranked: The Top 10 EV Battery Manufacturers in 2023
Asia dominates this ranking of the world’s largest EV battery manufacturers in 2023.

The Top 10 EV Battery Manufacturers in 2023
This was originally posted on our Voronoi app. Download the app for free on iOS or Android and discover incredible data-driven charts from a variety of trusted sources.
Despite efforts from the U.S. and EU to secure local domestic supply, all major EV battery manufacturers remain based in Asia.
In this graphic we rank the top 10 EV battery manufacturers by total battery deployment (measured in megawatt-hours) in 2023. The data is from EV Volumes.
Chinese Dominance
Contemporary Amperex Technology Co. Limited (CATL) has swiftly risen in less than a decade to claim the title of the largest global battery group.
The Chinese company now has a 34% share of the market and supplies batteries to a range of made-in-China vehicles, including the Tesla Model Y, SAIC’s MG4/Mulan, and Li Auto models.
| Company | Country | 2023 Production (megawatt-hour) | Share of Total Production |
|---|---|---|---|
| CATL | 🇨🇳China | 242,700 | 34% |
| BYD | 🇨🇳China | 115,917 | 16% |
| LG Energy Solution | 🇰🇷Korea | 108,487 | 15% |
| Panasonic | 🇯🇵Japan | 56,560 | 8% |
| SK On | 🇰🇷Korea | 40,711 | 6% |
| Samsung SDI | 🇰🇷Korea | 35,703 | 5% |
| CALB | 🇨🇳China | 23,493 | 3% |
| Farasis Energy | 🇨🇳China | 16,527 | 2% |
| Envision AESC | 🇨🇳China | 8,342 | 1% |
| Sunwoda | 🇨🇳China | 6,979 | 1% |
| Other | - | 56,040 | 8% |
In 2023, BYD surpassed LG Energy Solution to claim second place. This was driven by demand from its own models and growth in third-party deals, including providing batteries for the made-in-Germany Tesla Model Y, Toyota bZ3, Changan UNI-V, Venucia V-Online, as well as several Haval and FAW models.
The top three battery makers (CATL, BYD, LG) collectively account for two-thirds (66%) of total battery deployment.
Once a leader in the EV battery business, Panasonic now holds the fourth position with an 8% market share, down from 9% last year. With its main client, Tesla, now effectively sourcing batteries from multiple suppliers, the Japanese battery maker seems to be losing its competitive edge in the industry.
Overall, the global EV battery market size is projected to grow from $49 billion in 2022 to $98 billion by 2029, according to Fortune Business Insights.
Electrification
White Gold: Mapping U.S. Lithium Mines
In this graphic, Visual Capitalist partnerered with EnergyX to explore the size and location of U.S. lithium mines.

White Gold: Mapping U.S. Lithium Mines
The U.S. doubled imports of lithium-ion batteries for the third consecutive year in 2022, and with EV demand growing yearly, U.S. lithium mines must ramp up production or rely on other nations for their supply of refined lithium.
To determine if the domestic U.S. lithium opportunity can meet demand, we partnered with EnergyX to determine how much lithium sits within U.S. borders.
U.S. Lithium Projects
The most crucial measure of a lithium mine’s potential is the quantity that can be extracted from the source.
For each lithium resource, the potential volume of lithium carbonate equivalent (LCE) was calculated with a ratio of one metric ton of lithium producing 5.32 metric tons of LCE. Cumulatively, existing U.S. lithium projects contain 94.8 million metric tons of LCE.
| Rank | Project Name | LCE, million metric tons (est.) |
|---|---|---|
| 1 | McDermitt Caldera | 21.5 |
| 2 | Thacker Pass | 19.1 |
| 3 | Tonopah Flats | 18.0 |
| 4 | TLC Lithium | 10.7 |
| 5 | Clayton Valley (Century Lithium) | 6.3 |
| 6 | Zeus Lithium | 6.3 |
| 7 | Rhyolite Ridge | 3.4 |
| 8 | Arkansas Smackover (Phase 1A) | 2.8 |
| 9 | Basin Project | 2.2 |
| 10 | McGee Deposit | 2.1 |
| 11 | Arkansas Smackover (South West) | 1.8 |
| 12 | Clayton Valley (Lithium-X, Pure Energy) | 0.8 |
| 13 | Big Sandy | 0.3 |
| 14 | Imperial Valley/Salton Sea | 0.3 |
U.S. Lithium Opportunities, By State
U.S. lithium projects mainly exist in western states, with comparatively minor opportunities in central or eastern states.
| State | LCE, million metric tons (est.) |
|---|---|
| Nevada | 88.2 |
| Arkansas | 4.6 |
| Arizona | 2.5 |
| California | 0.3 |
Currently, the U.S. is sitting on a wealth of lithium that it is underutilizing. For context, in 2022, the U.S. only produced about 5,000 metric tons of LCE and imported a projected 19,000 metric tons of LCE, showing that the demand for the mineral is healthy.
The Next Gold Rush?
U.S. lithium companies have the opportunity to become global leaders in lithium production and accelerate the transition to sustainable energy sources. This is particularly important as the demand for lithium is increasing every year.
EnergyX is on a mission to meet U.S. lithium demands using groundbreaking technology that can extract 300% more lithium from a source than traditional methods.
You can take advantage of this opportunity by investing in EnergyX and joining other significant players like GM in becoming a shareholder.


-

 Electrification3 years ago
Ranked: The Top 10 EV Battery Manufacturers
-

 Electrification2 years ago
The Key Minerals in an EV Battery
-

 Real Assets3 years ago
The World’s Top 10 Gold Mining Companies
-

 Misc3 years ago
All the Metals We Mined in One Visualization
-

 Electrification3 years ago
The Biggest Mining Companies in the World in 2021
-

 Energy Shift2 years ago
What Are the Five Major Types of Renewable Energy?
-

 Electrification2 years ago
Mapped: Solar Power by Country in 2021
-

 Electrification2 years ago
The World’s Largest Nickel Mining Companies