

Electrification
Where are Clean Energy Technologies Manufactured?


Visualizing Where Clean Energy Technologies Are Manufactured
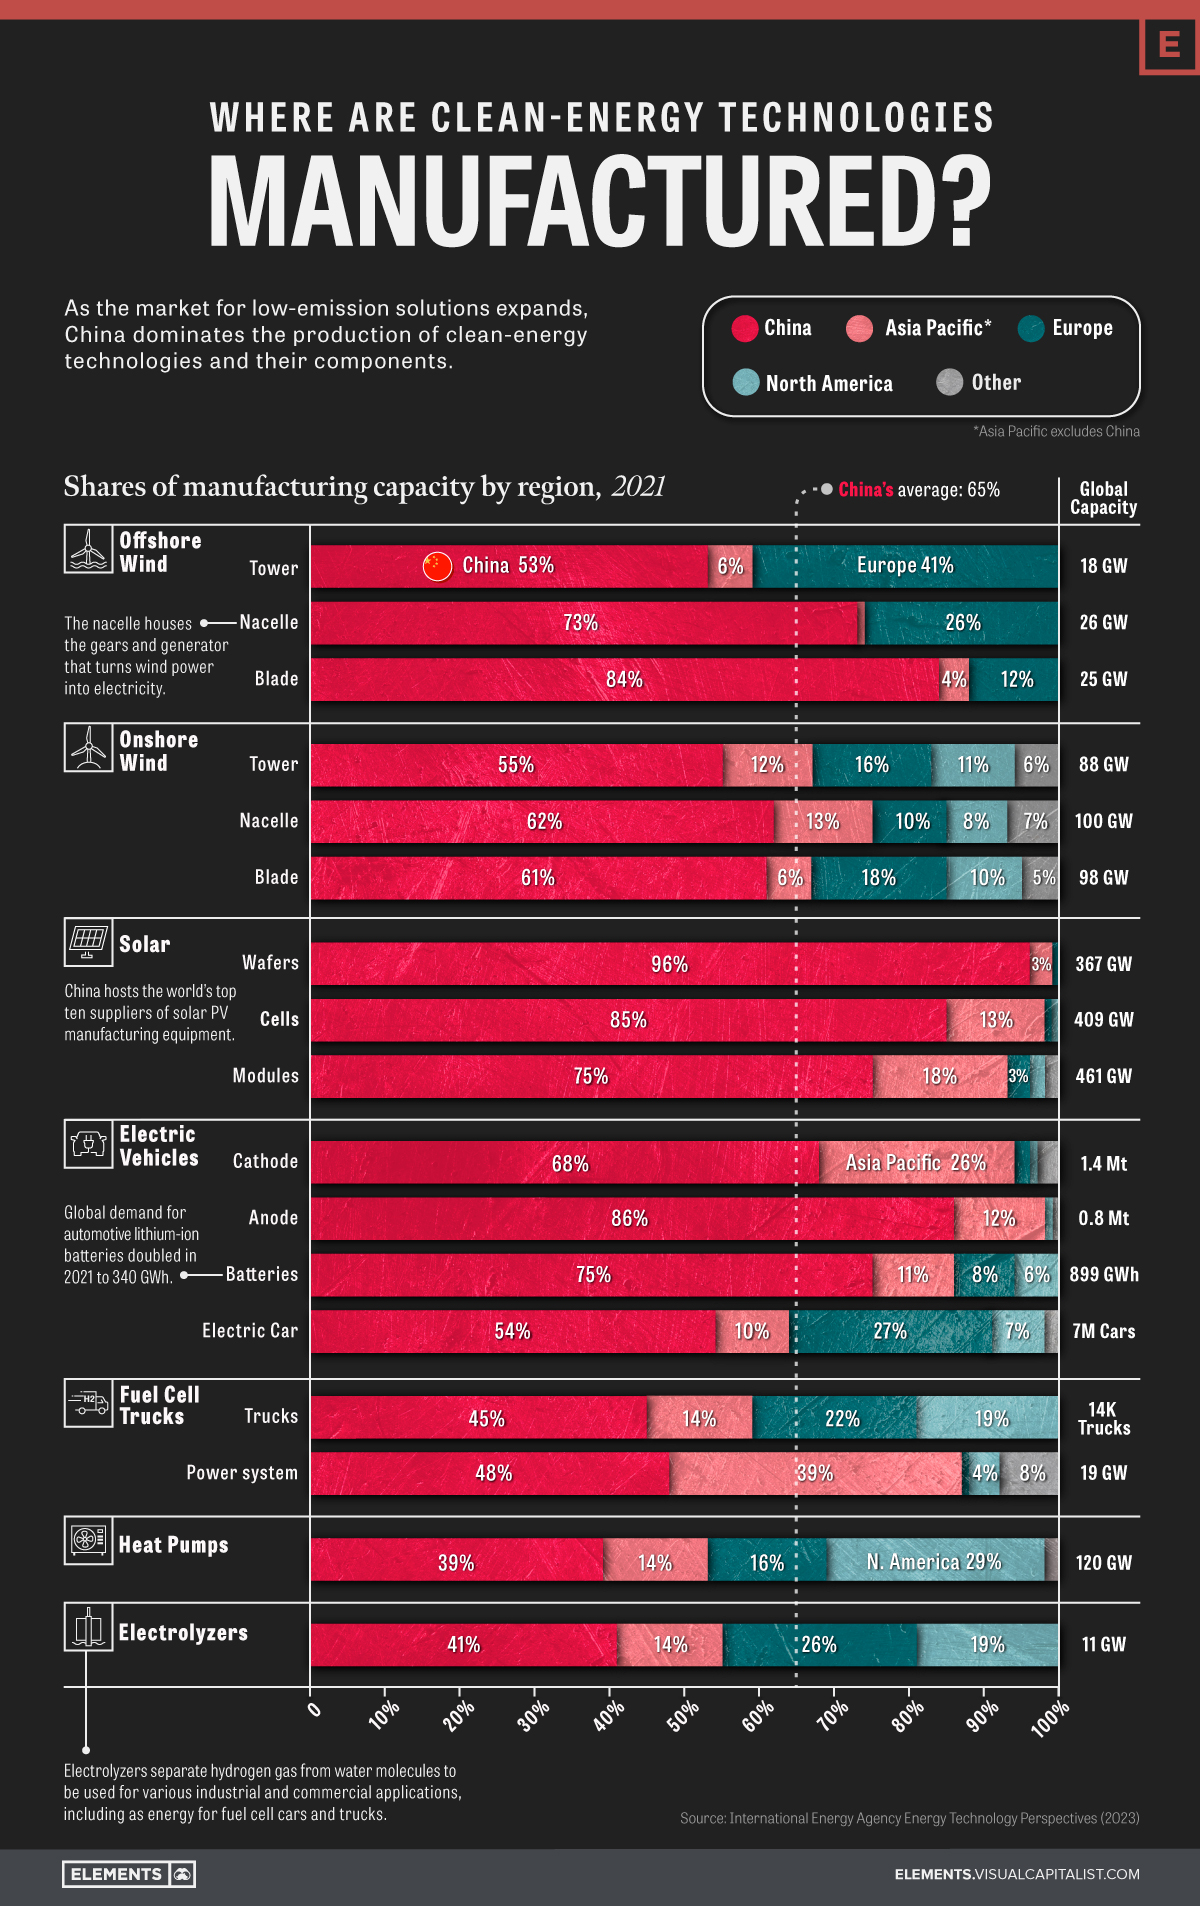
When looking at where clean energy technologies and their components are made, one thing is very clear: China dominates the industry.
The country, along with the rest of the Asia Pacific region, accounts for approximately 75% of global manufacturing capacity across seven clean energy technologies.
Based on the IEA’s 2023 Energy Technology Perspectives report, the visualization above breaks down global manufacturing capacity by region for mass-manufactured clean energy technologies, including onshore and offshore wind, solar photovoltaic (PV) systems, electric vehicles (EVs), fuel cell trucks, heat pumps, and electrolyzers.
The State of Global Manufacturing Capacity
Manufacturing capacity refers to the maximum amount of goods or products a facility can produce within a specific period. It is determined by several factors, including:
- The size of the manufacturing facility
- The number of machines or production lines available
- The skill level of the workforce
- The availability of raw materials
According to the IEA, the global manufacturing capacity for clean energy technologies may periodically exceed short-term production needs. Currently this is true especially for EV batteries, fuel cell trucks, and electrolyzers. For example, while only 900 fuel cell trucks were sold globally in 2021, the aggregate self-reported capacity by manufacturers was 14,000 trucks.
With that said, there still needs to be a significant increase in manufacturing capacity in the coming decades if demand aligns with the IEA’s 2050 net-zero emissions scenario. Such developments require investments in new equipment and technology, developing the clean energy workforce, access to raw and refined materials, and optimizing production processes to improve efficiency.
What Gives China the Advantage?
Of the above clean energy technologies and their components, China averages 65% of global manufacturing capacity. For certain components, like solar PV wafers, this percentage is as high as 96%.
Here’s a breakdown of China’s manufacturing capacity per clean energy technology.
| Technology | China’s share of global manufacturing capacity, 2021 |
|---|---|
| Wind (Offshore) | 70% |
| Wind (Onshore) | 59% |
| Solar PV Systems | 85% |
| Electric Vehicles | 71% |
| Fuel Cell Trucks | 47% |
| Heat Pumps | 39% |
| Electrolyzers | 41% |
So, what gives China this advantage in the clean energy technology sector? According to the IEA report, the answer lies in a combination of factors:
- Low manufacturing costs
- A dominance in clean energy metal processing, namely cobalt, lithium, and rare earth metals
- Sustained policy support and investment
The mixture of these factors has allowed China to capture a significant share of the global market for clean technologies while driving down the cost of clean energy worldwide.
As the market for low-emission solutions expands, China’s dominance in the sector will likely continue in the coming years and have notable implications for the global energy and emission landscape.


Electrification
Ranked: The Top 10 EV Battery Manufacturers in 2023
Asia dominates this ranking of the world’s largest EV battery manufacturers in 2023.

The Top 10 EV Battery Manufacturers in 2023
This was originally posted on our Voronoi app. Download the app for free on iOS or Android and discover incredible data-driven charts from a variety of trusted sources.
Despite efforts from the U.S. and EU to secure local domestic supply, all major EV battery manufacturers remain based in Asia.
In this graphic we rank the top 10 EV battery manufacturers by total battery deployment (measured in megawatt-hours) in 2023. The data is from EV Volumes.
Chinese Dominance
Contemporary Amperex Technology Co. Limited (CATL) has swiftly risen in less than a decade to claim the title of the largest global battery group.
The Chinese company now has a 34% share of the market and supplies batteries to a range of made-in-China vehicles, including the Tesla Model Y, SAIC’s MG4/Mulan, and Li Auto models.
| Company | Country | 2023 Production (megawatt-hour) | Share of Total Production |
|---|---|---|---|
| CATL | 🇨🇳China | 242,700 | 34% |
| BYD | 🇨🇳China | 115,917 | 16% |
| LG Energy Solution | 🇰🇷Korea | 108,487 | 15% |
| Panasonic | 🇯🇵Japan | 56,560 | 8% |
| SK On | 🇰🇷Korea | 40,711 | 6% |
| Samsung SDI | 🇰🇷Korea | 35,703 | 5% |
| CALB | 🇨🇳China | 23,493 | 3% |
| Farasis Energy | 🇨🇳China | 16,527 | 2% |
| Envision AESC | 🇨🇳China | 8,342 | 1% |
| Sunwoda | 🇨🇳China | 6,979 | 1% |
| Other | - | 56,040 | 8% |
In 2023, BYD surpassed LG Energy Solution to claim second place. This was driven by demand from its own models and growth in third-party deals, including providing batteries for the made-in-Germany Tesla Model Y, Toyota bZ3, Changan UNI-V, Venucia V-Online, as well as several Haval and FAW models.
The top three battery makers (CATL, BYD, LG) collectively account for two-thirds (66%) of total battery deployment.
Once a leader in the EV battery business, Panasonic now holds the fourth position with an 8% market share, down from 9% last year. With its main client, Tesla, now effectively sourcing batteries from multiple suppliers, the Japanese battery maker seems to be losing its competitive edge in the industry.
Overall, the global EV battery market size is projected to grow from $49 billion in 2022 to $98 billion by 2029, according to Fortune Business Insights.
Electrification
White Gold: Mapping U.S. Lithium Mines
In this graphic, Visual Capitalist partnerered with EnergyX to explore the size and location of U.S. lithium mines.

White Gold: Mapping U.S. Lithium Mines
The U.S. doubled imports of lithium-ion batteries for the third consecutive year in 2022, and with EV demand growing yearly, U.S. lithium mines must ramp up production or rely on other nations for their supply of refined lithium.
To determine if the domestic U.S. lithium opportunity can meet demand, we partnered with EnergyX to determine how much lithium sits within U.S. borders.
U.S. Lithium Projects
The most crucial measure of a lithium mine’s potential is the quantity that can be extracted from the source.
For each lithium resource, the potential volume of lithium carbonate equivalent (LCE) was calculated with a ratio of one metric ton of lithium producing 5.32 metric tons of LCE. Cumulatively, existing U.S. lithium projects contain 94.8 million metric tons of LCE.
| Rank | Project Name | LCE, million metric tons (est.) |
|---|---|---|
| 1 | McDermitt Caldera | 21.5 |
| 2 | Thacker Pass | 19.1 |
| 3 | Tonopah Flats | 18.0 |
| 4 | TLC Lithium | 10.7 |
| 5 | Clayton Valley (Century Lithium) | 6.3 |
| 6 | Zeus Lithium | 6.3 |
| 7 | Rhyolite Ridge | 3.4 |
| 8 | Arkansas Smackover (Phase 1A) | 2.8 |
| 9 | Basin Project | 2.2 |
| 10 | McGee Deposit | 2.1 |
| 11 | Arkansas Smackover (South West) | 1.8 |
| 12 | Clayton Valley (Lithium-X, Pure Energy) | 0.8 |
| 13 | Big Sandy | 0.3 |
| 14 | Imperial Valley/Salton Sea | 0.3 |
U.S. Lithium Opportunities, By State
U.S. lithium projects mainly exist in western states, with comparatively minor opportunities in central or eastern states.
| State | LCE, million metric tons (est.) |
|---|---|
| Nevada | 88.2 |
| Arkansas | 4.6 |
| Arizona | 2.5 |
| California | 0.3 |
Currently, the U.S. is sitting on a wealth of lithium that it is underutilizing. For context, in 2022, the U.S. only produced about 5,000 metric tons of LCE and imported a projected 19,000 metric tons of LCE, showing that the demand for the mineral is healthy.
The Next Gold Rush?
U.S. lithium companies have the opportunity to become global leaders in lithium production and accelerate the transition to sustainable energy sources. This is particularly important as the demand for lithium is increasing every year.
EnergyX is on a mission to meet U.S. lithium demands using groundbreaking technology that can extract 300% more lithium from a source than traditional methods.
You can take advantage of this opportunity by investing in EnergyX and joining other significant players like GM in becoming a shareholder.


-

 Electrification3 years ago
Ranked: The Top 10 EV Battery Manufacturers
-

 Electrification2 years ago
The Key Minerals in an EV Battery
-

 Real Assets3 years ago
The World’s Top 10 Gold Mining Companies
-

 Misc3 years ago
All the Metals We Mined in One Visualization
-

 Electrification3 years ago
The Biggest Mining Companies in the World in 2021
-

 Energy Shift2 years ago
What Are the Five Major Types of Renewable Energy?
-

 Electrification2 years ago
Mapped: Solar Power by Country in 2021
-

 Electrification2 years ago
The World’s Largest Nickel Mining Companies