

Electrification
Visualizing the Growing Demand for Nickel and Copper
The following content is sponsored by Premium Nickel
Visualizing the Growing Demand for Nickel and Copper
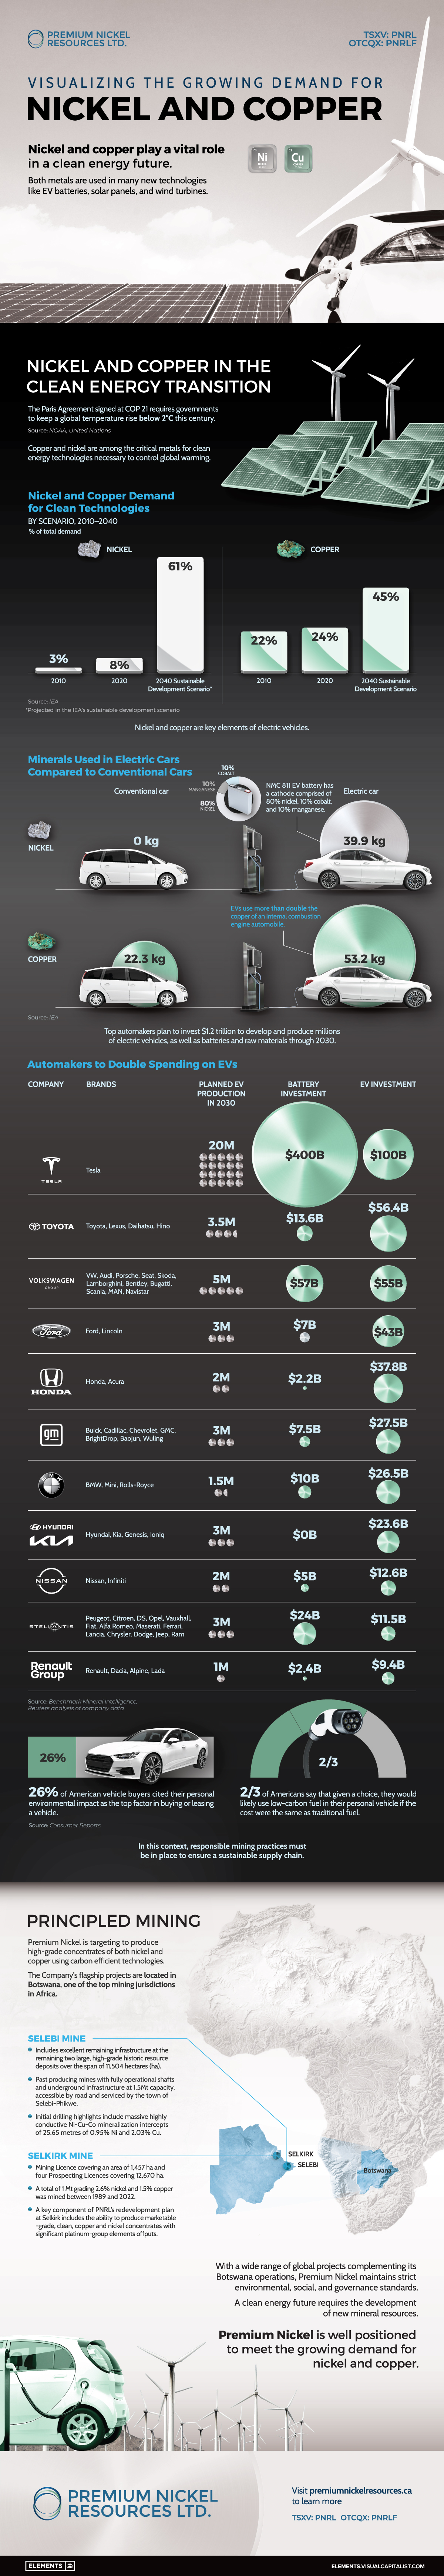
Nickel and copper play a vital role in a clean energy future, as both metals are used in many new technologies like EV batteries, solar panels, and wind turbines.
This visualization from our sponsor Premium Nickel explores how responsible mining will be essential to meet the demand for these metals.
Nickel and Copper in the Clean Energy Transition
Copper is a critical mineral in the production of EVs, used in electric motors, batteries, and charging infrastructure. The metal is an excellent conductor of electricity, making it ideal for use in vehicles.
According to the International Energy Agency (IEA), an average EV can contain around 53kg of copper compared to 22kg in a combustion vehicle. As a result, copper demand for EV batteries alone is expected to jump from 210,000 tonnes in 2020 to 1.8 million tonnes in 2030.
| Mineral | Content in electric vehicles (kg) | Content in conventional cars (kg) |
|---|---|---|
| Graphite (natural and synthetic) | 66.3 | 0 |
| Copper | 53.2 | 22.3 |
| Nickel | 39.9 | 0 |
| Manganese | 24.5 | 11.2 |
| Cobalt | 13.3 | 0 |
| Lithium | 8.9 | 0 |
| Rare earths | 0.5 | 0 |
| Zinc | 0.1 | 0.1 |
| Others | 0.3 | 0.3 |
Nickel is another important mineral in the clean energy transition, as it is used in the production of EV batteries. One of the benefits of using nickel in EV batteries is that it can increase the energy density of the battery.
Additionally, nickel can help to reduce the cost of EV batteries, as it is less expensive than other materials commonly used in battery production.
In a scenario that meets the Paris Agreement goals, clean energy technologies’ share of total nickel demand rises significantly over the next two decades to over 60%.
Pioneering Principled Copper and Nickel Mining
Nickel and copper production are both currently emissions intensive.
For copper, the emissions intensity is about 4.5 kg of CO2 for every kg produced. Nickel’s emissions intensity varies from ~20–80 kg CO2 per kg of nickel produced, depending on the purity of the final product and the extraction process used.
Recent research has shown that consumers are also more aware of their environmental impact. In fact, 26% of American vehicle buyers cited their personal environmental impact as the top influencing factor in buying or leasing a vehicle.
In this context, responsible mining practices must be in place to ensure a sustainable supply chain.
Premium Nickel is targeting to produce high-grade concentrates of both nickel and copper using carbon efficient technologies.
The company’s flagship projects in Botswana are been developed to minimize the environmental footprint, using less power, less water, alternative energy sources.
Using new technology and working closely with the community, the company has adopted the highest international standards for the protection of the environment, while developing its projects.
Premium Nickel is well positioned to meet the growing demand for nickel and copper. Click here to learn more about the company.


Electrification
Ranked: The Top 10 EV Battery Manufacturers in 2023
Asia dominates this ranking of the world’s largest EV battery manufacturers in 2023.

The Top 10 EV Battery Manufacturers in 2023
This was originally posted on our Voronoi app. Download the app for free on iOS or Android and discover incredible data-driven charts from a variety of trusted sources.
Despite efforts from the U.S. and EU to secure local domestic supply, all major EV battery manufacturers remain based in Asia.
In this graphic we rank the top 10 EV battery manufacturers by total battery deployment (measured in megawatt-hours) in 2023. The data is from EV Volumes.
Chinese Dominance
Contemporary Amperex Technology Co. Limited (CATL) has swiftly risen in less than a decade to claim the title of the largest global battery group.
The Chinese company now has a 34% share of the market and supplies batteries to a range of made-in-China vehicles, including the Tesla Model Y, SAIC’s MG4/Mulan, and Li Auto models.
| Company | Country | 2023 Production (megawatt-hour) | Share of Total Production |
|---|---|---|---|
| CATL | 🇨🇳China | 242,700 | 34% |
| BYD | 🇨🇳China | 115,917 | 16% |
| LG Energy Solution | 🇰🇷Korea | 108,487 | 15% |
| Panasonic | 🇯🇵Japan | 56,560 | 8% |
| SK On | 🇰🇷Korea | 40,711 | 6% |
| Samsung SDI | 🇰🇷Korea | 35,703 | 5% |
| CALB | 🇨🇳China | 23,493 | 3% |
| Farasis Energy | 🇨🇳China | 16,527 | 2% |
| Envision AESC | 🇨🇳China | 8,342 | 1% |
| Sunwoda | 🇨🇳China | 6,979 | 1% |
| Other | - | 56,040 | 8% |
In 2023, BYD surpassed LG Energy Solution to claim second place. This was driven by demand from its own models and growth in third-party deals, including providing batteries for the made-in-Germany Tesla Model Y, Toyota bZ3, Changan UNI-V, Venucia V-Online, as well as several Haval and FAW models.
The top three battery makers (CATL, BYD, LG) collectively account for two-thirds (66%) of total battery deployment.
Once a leader in the EV battery business, Panasonic now holds the fourth position with an 8% market share, down from 9% last year. With its main client, Tesla, now effectively sourcing batteries from multiple suppliers, the Japanese battery maker seems to be losing its competitive edge in the industry.
Overall, the global EV battery market size is projected to grow from $49 billion in 2022 to $98 billion by 2029, according to Fortune Business Insights.
Electrification
White Gold: Mapping U.S. Lithium Mines
In this graphic, Visual Capitalist partnerered with EnergyX to explore the size and location of U.S. lithium mines.

White Gold: Mapping U.S. Lithium Mines
The U.S. doubled imports of lithium-ion batteries for the third consecutive year in 2022, and with EV demand growing yearly, U.S. lithium mines must ramp up production or rely on other nations for their supply of refined lithium.
To determine if the domestic U.S. lithium opportunity can meet demand, we partnered with EnergyX to determine how much lithium sits within U.S. borders.
U.S. Lithium Projects
The most crucial measure of a lithium mine’s potential is the quantity that can be extracted from the source.
For each lithium resource, the potential volume of lithium carbonate equivalent (LCE) was calculated with a ratio of one metric ton of lithium producing 5.32 metric tons of LCE. Cumulatively, existing U.S. lithium projects contain 94.8 million metric tons of LCE.
| Rank | Project Name | LCE, million metric tons (est.) |
|---|---|---|
| 1 | McDermitt Caldera | 21.5 |
| 2 | Thacker Pass | 19.1 |
| 3 | Tonopah Flats | 18.0 |
| 4 | TLC Lithium | 10.7 |
| 5 | Clayton Valley (Century Lithium) | 6.3 |
| 6 | Zeus Lithium | 6.3 |
| 7 | Rhyolite Ridge | 3.4 |
| 8 | Arkansas Smackover (Phase 1A) | 2.8 |
| 9 | Basin Project | 2.2 |
| 10 | McGee Deposit | 2.1 |
| 11 | Arkansas Smackover (South West) | 1.8 |
| 12 | Clayton Valley (Lithium-X, Pure Energy) | 0.8 |
| 13 | Big Sandy | 0.3 |
| 14 | Imperial Valley/Salton Sea | 0.3 |
U.S. Lithium Opportunities, By State
U.S. lithium projects mainly exist in western states, with comparatively minor opportunities in central or eastern states.
| State | LCE, million metric tons (est.) |
|---|---|
| Nevada | 88.2 |
| Arkansas | 4.6 |
| Arizona | 2.5 |
| California | 0.3 |
Currently, the U.S. is sitting on a wealth of lithium that it is underutilizing. For context, in 2022, the U.S. only produced about 5,000 metric tons of LCE and imported a projected 19,000 metric tons of LCE, showing that the demand for the mineral is healthy.
The Next Gold Rush?
U.S. lithium companies have the opportunity to become global leaders in lithium production and accelerate the transition to sustainable energy sources. This is particularly important as the demand for lithium is increasing every year.
EnergyX is on a mission to meet U.S. lithium demands using groundbreaking technology that can extract 300% more lithium from a source than traditional methods.
You can take advantage of this opportunity by investing in EnergyX and joining other significant players like GM in becoming a shareholder.


-

 Electrification3 years ago
Ranked: The Top 10 EV Battery Manufacturers
-

 Electrification2 years ago
The Key Minerals in an EV Battery
-

 Real Assets3 years ago
The World’s Top 10 Gold Mining Companies
-

 Misc3 years ago
All the Metals We Mined in One Visualization
-

 Electrification3 years ago
The Biggest Mining Companies in the World in 2021
-

 Energy Shift2 years ago
What Are the Five Major Types of Renewable Energy?
-

 Electrification2 years ago
Mapped: Solar Power by Country in 2021
-

 Electrification2 years ago
The World’s Largest Nickel Mining Companies