

Asia dominates this ranking of the world's largest EV battery manufacturers in 2023.


Despite concerns about nuclear waste, high-level radioactive waste constitutes less than 0.25% of all radioactive waste ever generated.


Breaking down the distribution of cash spending by the global oil and gas industry between 2015 and 2022.


This graphic explores how recycling copper can help address the demand for the metal in the U.S.
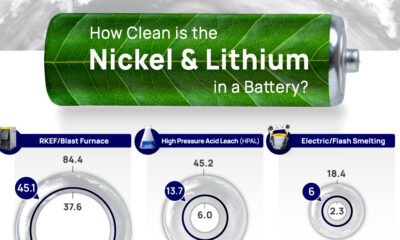

This graphic from Wood Mackenzie shows how nickel and lithium mining can significantly impact the environment, depending on the processes used.
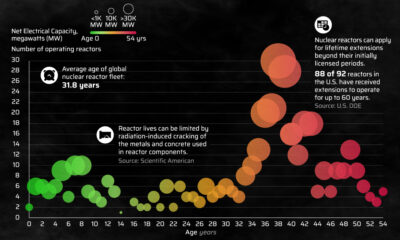

Of the 422 nuclear reactors operating globally, 262 reactors are 31 to 50 years old. This infographic charts nuclear reactors by age in 2023.
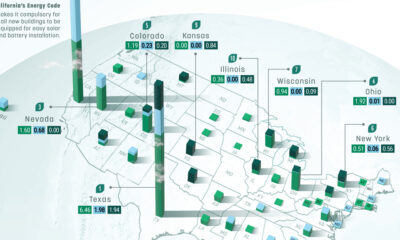

This graphic describes new U.S. renewable energy installations by state along with nameplate capacity, planned to come online in 2023.
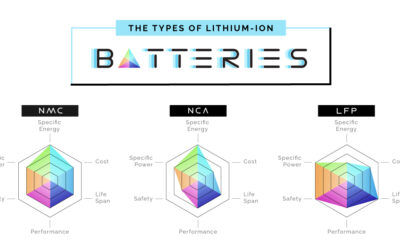

This infographic compares the six major types of lithium-ion batteries in terms of performance, safety, lifespan, and other dimensions.
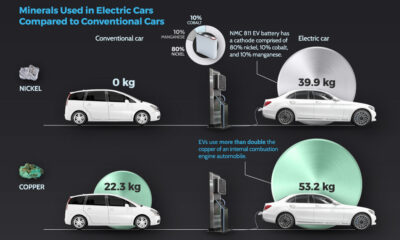

This visualization explores how responsible mining will be essential to meet the demand for copper and nickel.
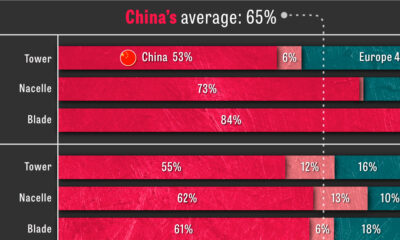

As the market for low-emission solutions expands, China dominates the production of clean energy technologies and their components.


