

Electrification
Visualizing the World’s Largest Lithium Producers


Visualizing the World’s Largest Lithium Producers in 2022
Lithium has become essential in recent years, primarily due to the boom in electric vehicles and other clean technologies that rely on lithium batteries.
The global lithium-ion battery market was valued at $52 billion in 2022 and is expected to reach $194 billion in 2030.
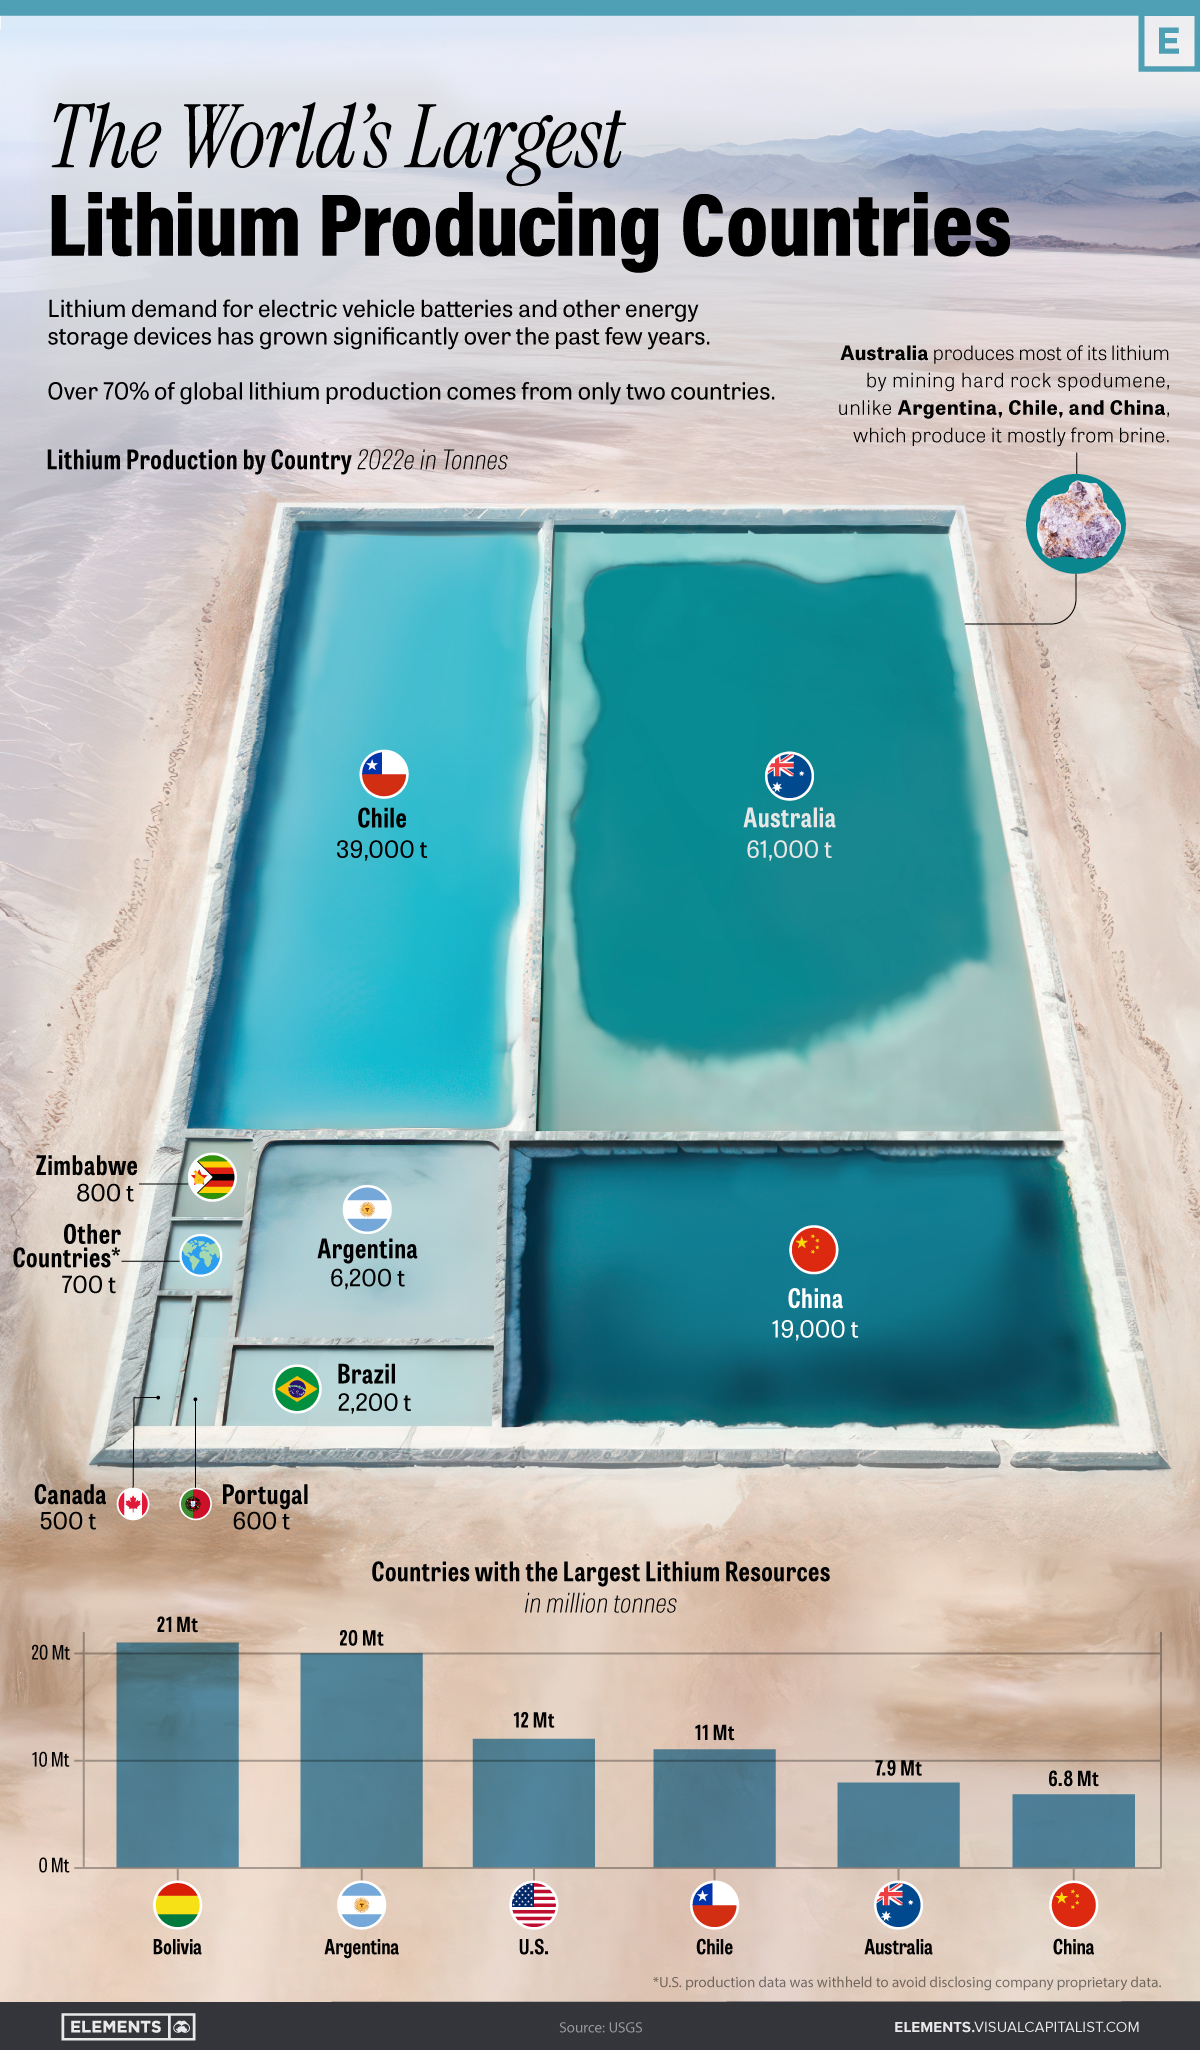
The infographic above uses data from the United States Geological Survey to explore the world’s largest lithium producing countries.
Australia and Chile: Dominating Global Lithium Supply
Australia and Chile stand out as the top producers of lithium, accounting for almost 77% of the global production in 2022.
| Rank | Country | Mine production 2022E (tonnes) | Share (%) |
|---|---|---|---|
| 1 | 🇦🇺 Australia | 61,000 | 46.9% |
| 2 | 🇨🇱 Chile | 39,000 | 30.0% |
| 3 | 🇨🇳 China | 19,000 | 14.6% |
| 4 | 🇦🇷 Argentina | 6,200 | 4.8% |
| 5 | 🇧🇷 Brazil | 2,200 | 1.7% |
| 6 | 🇿🇼 Zimbabwe | 800 | 0.6% |
| 7 | 🇵🇹 Portugal | 600 | 0.5% |
| 8 | 🇨🇦 Canada | 500 | 0.4% |
| 🌎 Other countries* | 700 | 0.5% | |
| 🌐 World Total | 130,000 | 100.0% |
*U.S. production data was withheld to avoid disclosing proprietary company data
Australia, the world’s leading producer, extracts lithium directly from hard rock mines, specifically the mineral spodumene.
Chile, along with Argentina, China, and other top producers, extracts lithium from brine.
Hard rock provides greater flexibility as lithium hosted in spodumene can be processed into either lithium hydroxide or lithium carbonate. It also offers faster processing and higher quality as spodumene typically contains higher lithium content.
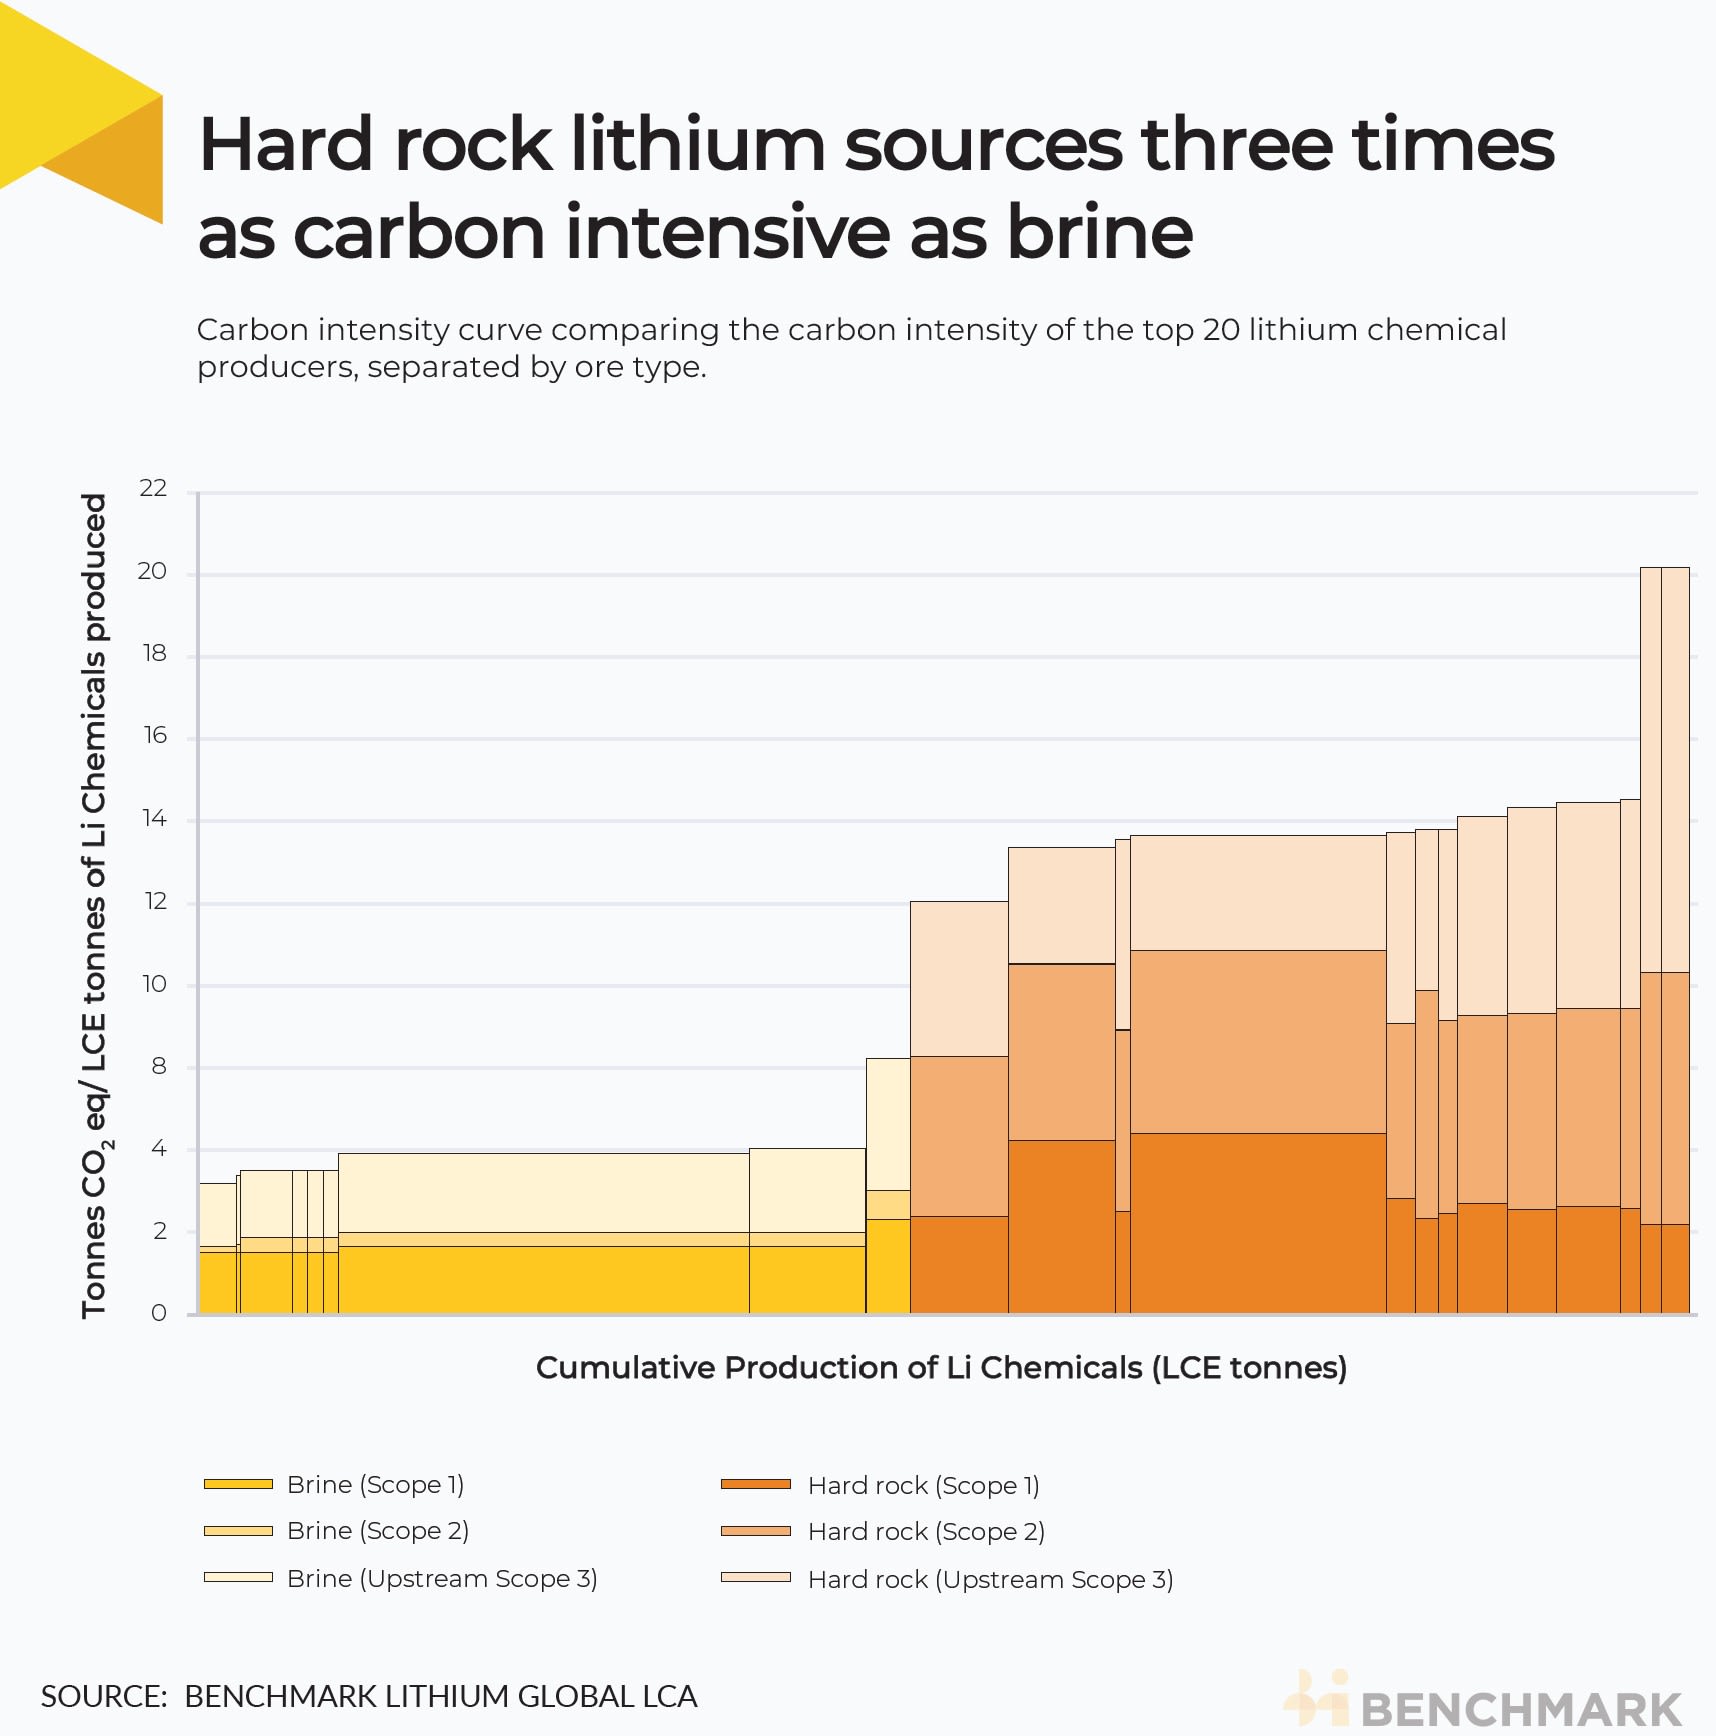
Extracting lithium from brine, on the other hand, offers the advantage of lower production costs and a smaller impact on the environment. The following visual from Benchmark Minerals helps break down the carbon impact of different types of lithium extraction.
With that said, brine extraction can also face challenges related to water availability and environmental impacts on local ecosystems.
Historical Shifts in the Lithium Supply Chain
In the 1990s, the United States held the title of the largest lithium producer, producing over one-third of the global production in 1995.
However, Chile eventually overtook the U.S., experiencing a production boom in the Salar de Atacama, one of the world’s richest lithium brine deposits. Since then, Australia’s lithium production has also skyrocketed, now accounting for 47% of the world’s lithium production.
China, the world’s third-largest producer, not only focuses on developing domestic mines but has also strategically acquired approximately $5.6 billion worth of lithium assets in countries like Chile, Canada, and Australia over the past decade.
Furthermore, China currently hosts nearly 60% of the world’s lithium refining capacity for batteries, underlining its dominant position in the lithium supply chain.
Meeting Lithium Demand: The Need for New Production
As the world increases its production of batteries and electric vehicles, the demand for lithium is projected to soar.
In 2021, global lithium carbonate equivalent (LCE) production sat at 540,000 tonnes.
By 2025, demand is expected to reach 1.5 million tonnes of LCE. By 2030, this number is estimated to exceed 3 million tonnes.


Electrification
Ranked: The Top 10 EV Battery Manufacturers in 2023
Asia dominates this ranking of the world’s largest EV battery manufacturers in 2023.

The Top 10 EV Battery Manufacturers in 2023
This was originally posted on our Voronoi app. Download the app for free on iOS or Android and discover incredible data-driven charts from a variety of trusted sources.
Despite efforts from the U.S. and EU to secure local domestic supply, all major EV battery manufacturers remain based in Asia.
In this graphic we rank the top 10 EV battery manufacturers by total battery deployment (measured in megawatt-hours) in 2023. The data is from EV Volumes.
Chinese Dominance
Contemporary Amperex Technology Co. Limited (CATL) has swiftly risen in less than a decade to claim the title of the largest global battery group.
The Chinese company now has a 34% share of the market and supplies batteries to a range of made-in-China vehicles, including the Tesla Model Y, SAIC’s MG4/Mulan, and Li Auto models.
| Company | Country | 2023 Production (megawatt-hour) | Share of Total Production |
|---|---|---|---|
| CATL | 🇨🇳China | 242,700 | 34% |
| BYD | 🇨🇳China | 115,917 | 16% |
| LG Energy Solution | 🇰🇷Korea | 108,487 | 15% |
| Panasonic | 🇯🇵Japan | 56,560 | 8% |
| SK On | 🇰🇷Korea | 40,711 | 6% |
| Samsung SDI | 🇰🇷Korea | 35,703 | 5% |
| CALB | 🇨🇳China | 23,493 | 3% |
| Farasis Energy | 🇨🇳China | 16,527 | 2% |
| Envision AESC | 🇨🇳China | 8,342 | 1% |
| Sunwoda | 🇨🇳China | 6,979 | 1% |
| Other | - | 56,040 | 8% |
In 2023, BYD surpassed LG Energy Solution to claim second place. This was driven by demand from its own models and growth in third-party deals, including providing batteries for the made-in-Germany Tesla Model Y, Toyota bZ3, Changan UNI-V, Venucia V-Online, as well as several Haval and FAW models.
The top three battery makers (CATL, BYD, LG) collectively account for two-thirds (66%) of total battery deployment.
Once a leader in the EV battery business, Panasonic now holds the fourth position with an 8% market share, down from 9% last year. With its main client, Tesla, now effectively sourcing batteries from multiple suppliers, the Japanese battery maker seems to be losing its competitive edge in the industry.
Overall, the global EV battery market size is projected to grow from $49 billion in 2022 to $98 billion by 2029, according to Fortune Business Insights.
Electrification
White Gold: Mapping U.S. Lithium Mines
In this graphic, Visual Capitalist partnerered with EnergyX to explore the size and location of U.S. lithium mines.

White Gold: Mapping U.S. Lithium Mines
The U.S. doubled imports of lithium-ion batteries for the third consecutive year in 2022, and with EV demand growing yearly, U.S. lithium mines must ramp up production or rely on other nations for their supply of refined lithium.
To determine if the domestic U.S. lithium opportunity can meet demand, we partnered with EnergyX to determine how much lithium sits within U.S. borders.
U.S. Lithium Projects
The most crucial measure of a lithium mine’s potential is the quantity that can be extracted from the source.
For each lithium resource, the potential volume of lithium carbonate equivalent (LCE) was calculated with a ratio of one metric ton of lithium producing 5.32 metric tons of LCE. Cumulatively, existing U.S. lithium projects contain 94.8 million metric tons of LCE.
| Rank | Project Name | LCE, million metric tons (est.) |
|---|---|---|
| 1 | McDermitt Caldera | 21.5 |
| 2 | Thacker Pass | 19.1 |
| 3 | Tonopah Flats | 18.0 |
| 4 | TLC Lithium | 10.7 |
| 5 | Clayton Valley (Century Lithium) | 6.3 |
| 6 | Zeus Lithium | 6.3 |
| 7 | Rhyolite Ridge | 3.4 |
| 8 | Arkansas Smackover (Phase 1A) | 2.8 |
| 9 | Basin Project | 2.2 |
| 10 | McGee Deposit | 2.1 |
| 11 | Arkansas Smackover (South West) | 1.8 |
| 12 | Clayton Valley (Lithium-X, Pure Energy) | 0.8 |
| 13 | Big Sandy | 0.3 |
| 14 | Imperial Valley/Salton Sea | 0.3 |
U.S. Lithium Opportunities, By State
U.S. lithium projects mainly exist in western states, with comparatively minor opportunities in central or eastern states.
| State | LCE, million metric tons (est.) |
|---|---|
| Nevada | 88.2 |
| Arkansas | 4.6 |
| Arizona | 2.5 |
| California | 0.3 |
Currently, the U.S. is sitting on a wealth of lithium that it is underutilizing. For context, in 2022, the U.S. only produced about 5,000 metric tons of LCE and imported a projected 19,000 metric tons of LCE, showing that the demand for the mineral is healthy.
The Next Gold Rush?
U.S. lithium companies have the opportunity to become global leaders in lithium production and accelerate the transition to sustainable energy sources. This is particularly important as the demand for lithium is increasing every year.
EnergyX is on a mission to meet U.S. lithium demands using groundbreaking technology that can extract 300% more lithium from a source than traditional methods.
You can take advantage of this opportunity by investing in EnergyX and joining other significant players like GM in becoming a shareholder.


-

 Electrification3 years ago
Ranked: The Top 10 EV Battery Manufacturers
-

 Electrification2 years ago
The Key Minerals in an EV Battery
-

 Real Assets3 years ago
The World’s Top 10 Gold Mining Companies
-

 Misc3 years ago
All the Metals We Mined in One Visualization
-

 Electrification3 years ago
The Biggest Mining Companies in the World in 2021
-

 Energy Shift2 years ago
What Are the Five Major Types of Renewable Energy?
-

 Electrification2 years ago
Mapped: Solar Power by Country in 2021
-

 Electrification2 years ago
The World’s Largest Nickel Mining Companies