

Electrification
Visualizing 25 Years of Lithium Production, by Country
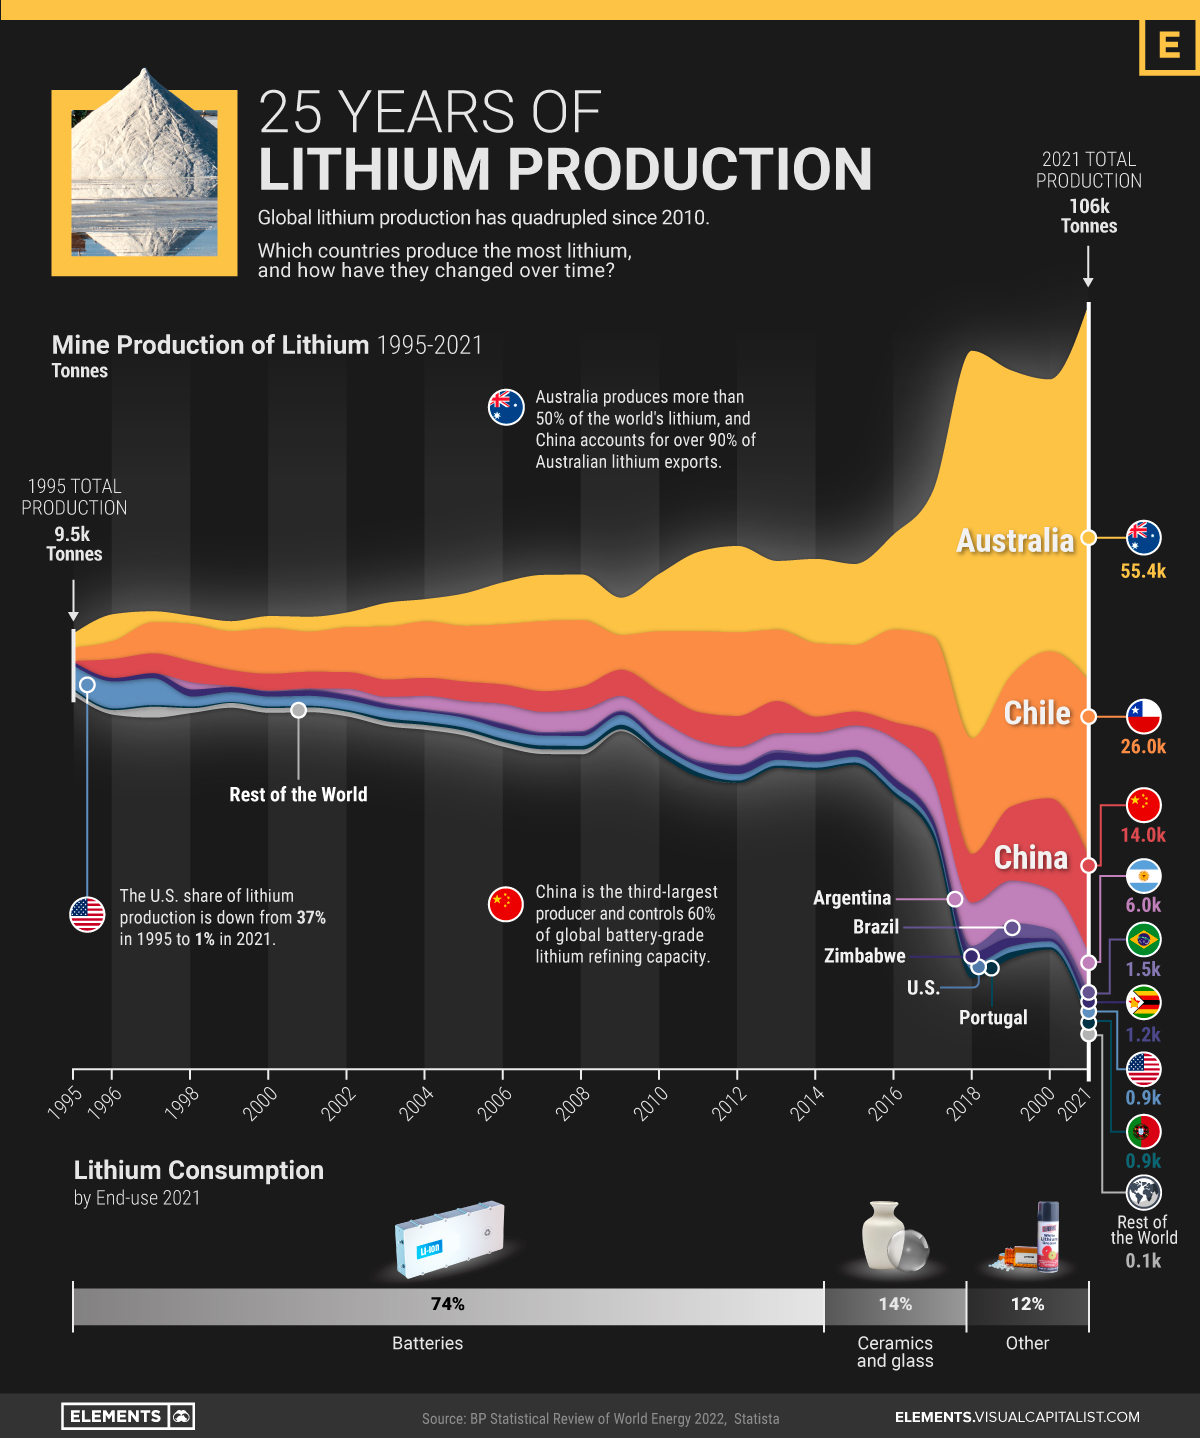


Lithium Production by Country (1995-2021)
Lithium is often dubbed as “white gold” for electric vehicles.
The lightweight metal plays a key role in the cathodes of all types of lithium-ion batteries that power EVs. Accordingly, the recent rise in EV adoption has sent lithium production to new highs.
The above infographic charts more than 25 years of lithium production by country from 1995 to 2021, based on data from BP’s Statistical Review of World Energy.
The Largest Lithium Producers Over Time
In the 1990s, the U.S. was the largest producer of lithium, in stark contrast to the present.
In fact, the U.S. accounted for over one-third of global lithium production in 1995. From then onwards until 2010, Chile took over as the biggest producer with a production boom in the Salar de Atacama, one of the world’s richest lithium brine deposits.
Global lithium production surpassed 100,000 tonnes for the first time in 2021, quadrupling from 2010. What’s more, roughly 90% of it came from just three countries.
| Rank | Country | 2021 Production (tonnes) | % of Total |
|---|---|---|---|
| #1 | Australia 🇦🇺 | 55,416 | 52% |
| #2 | Chile 🇨🇱 | 26,000 | 25% |
| #3 | China 🇨🇳 | 14,000 | 13% |
| #4 | Argentina 🇦🇷 | 5,967 | 6% |
| #5 | Brazil 🇧🇷 | 1,500 | 1% |
| #6 | Zimbabwe 🇿🇼 | 1,200 | 1% |
| #7 | Portugal 🇵🇹 | 900 | 1% |
| #8 | United States 🇺🇸 | 900 | 1% |
| Rest of World 🌍 | 102 | 0.1% | |
| Total | 105,984 | 100% |
Australia alone produces 52% of the world’s lithium. Unlike Chile, where lithium is extracted from brines, Australian lithium comes from hard-rock mines for the mineral spodumene.
China, the third-largest producer, has a strong foothold in the lithium supply chain. Alongside developing domestic mines, Chinese companies have acquired around $5.6 billion worth of lithium assets in countries like Chile, Canada, and Australia over the last decade. It also hosts 60% of the world’s lithium refining capacity for batteries.
Batteries have been one of the primary drivers of the exponential increase in lithium production. But how much lithium do batteries use, and how much goes into other uses?
What is Lithium Used For?
While lithium is best known for its role in rechargeable batteries—and rightly so—it has many other important uses.
Before EVs and lithium-ion batteries transformed the demand for lithium, the metal’s end-uses looked completely different as compared to today.
| End-use | Lithium Consumption 2010 (%) | Lithium Consumption 2021 (%) |
|---|---|---|
| Batteries | 23% | 74% |
| Ceramics and glass | 31% | 14% |
| Lubricating greases | 10% | 3% |
| Air treatment | 5% | 1% |
| Continuous casting | 4% | 2% |
| Other | 27% | 6% |
| Total | 100% | 100% |
In 2010, ceramics and glass accounted for the largest share of lithium consumption at 31%. In ceramics and glassware, lithium carbonate increases strength and reduces thermal expansion, which is often essential for modern glass-ceramic cooktops.
Lithium is also used to make lubricant greases for the transport, steel, and aviation industries, along with other lesser-known uses.
The Future of Lithium Production
As the world produces more batteries and EVs, the demand for lithium is projected to reach 1.5 million tonnes of lithium carbonate equivalent (LCE) by 2025 and over 3 million tonnes by 2030.
For context, the world produced 540,000 tonnes of LCE in 2021. Based on the above demand projections, production needs to triple by 2025 and increase nearly six-fold by 2030.
Although supply has been on an exponential growth trajectory, it can take anywhere from six to more than 15 years for new lithium projects to come online. As a result, the lithium market is projected to be in a deficit for the next few years.


Electrification
Ranked: The Top 10 EV Battery Manufacturers in 2023
Asia dominates this ranking of the world’s largest EV battery manufacturers in 2023.

The Top 10 EV Battery Manufacturers in 2023
This was originally posted on our Voronoi app. Download the app for free on iOS or Android and discover incredible data-driven charts from a variety of trusted sources.
Despite efforts from the U.S. and EU to secure local domestic supply, all major EV battery manufacturers remain based in Asia.
In this graphic we rank the top 10 EV battery manufacturers by total battery deployment (measured in megawatt-hours) in 2023. The data is from EV Volumes.
Chinese Dominance
Contemporary Amperex Technology Co. Limited (CATL) has swiftly risen in less than a decade to claim the title of the largest global battery group.
The Chinese company now has a 34% share of the market and supplies batteries to a range of made-in-China vehicles, including the Tesla Model Y, SAIC’s MG4/Mulan, and Li Auto models.
| Company | Country | 2023 Production (megawatt-hour) | Share of Total Production |
|---|---|---|---|
| CATL | 🇨🇳China | 242,700 | 34% |
| BYD | 🇨🇳China | 115,917 | 16% |
| LG Energy Solution | 🇰🇷Korea | 108,487 | 15% |
| Panasonic | 🇯🇵Japan | 56,560 | 8% |
| SK On | 🇰🇷Korea | 40,711 | 6% |
| Samsung SDI | 🇰🇷Korea | 35,703 | 5% |
| CALB | 🇨🇳China | 23,493 | 3% |
| Farasis Energy | 🇨🇳China | 16,527 | 2% |
| Envision AESC | 🇨🇳China | 8,342 | 1% |
| Sunwoda | 🇨🇳China | 6,979 | 1% |
| Other | - | 56,040 | 8% |
In 2023, BYD surpassed LG Energy Solution to claim second place. This was driven by demand from its own models and growth in third-party deals, including providing batteries for the made-in-Germany Tesla Model Y, Toyota bZ3, Changan UNI-V, Venucia V-Online, as well as several Haval and FAW models.
The top three battery makers (CATL, BYD, LG) collectively account for two-thirds (66%) of total battery deployment.
Once a leader in the EV battery business, Panasonic now holds the fourth position with an 8% market share, down from 9% last year. With its main client, Tesla, now effectively sourcing batteries from multiple suppliers, the Japanese battery maker seems to be losing its competitive edge in the industry.
Overall, the global EV battery market size is projected to grow from $49 billion in 2022 to $98 billion by 2029, according to Fortune Business Insights.
Electrification
White Gold: Mapping U.S. Lithium Mines
In this graphic, Visual Capitalist partnerered with EnergyX to explore the size and location of U.S. lithium mines.

White Gold: Mapping U.S. Lithium Mines
The U.S. doubled imports of lithium-ion batteries for the third consecutive year in 2022, and with EV demand growing yearly, U.S. lithium mines must ramp up production or rely on other nations for their supply of refined lithium.
To determine if the domestic U.S. lithium opportunity can meet demand, we partnered with EnergyX to determine how much lithium sits within U.S. borders.
U.S. Lithium Projects
The most crucial measure of a lithium mine’s potential is the quantity that can be extracted from the source.
For each lithium resource, the potential volume of lithium carbonate equivalent (LCE) was calculated with a ratio of one metric ton of lithium producing 5.32 metric tons of LCE. Cumulatively, existing U.S. lithium projects contain 94.8 million metric tons of LCE.
| Rank | Project Name | LCE, million metric tons (est.) |
|---|---|---|
| 1 | McDermitt Caldera | 21.5 |
| 2 | Thacker Pass | 19.1 |
| 3 | Tonopah Flats | 18.0 |
| 4 | TLC Lithium | 10.7 |
| 5 | Clayton Valley (Century Lithium) | 6.3 |
| 6 | Zeus Lithium | 6.3 |
| 7 | Rhyolite Ridge | 3.4 |
| 8 | Arkansas Smackover (Phase 1A) | 2.8 |
| 9 | Basin Project | 2.2 |
| 10 | McGee Deposit | 2.1 |
| 11 | Arkansas Smackover (South West) | 1.8 |
| 12 | Clayton Valley (Lithium-X, Pure Energy) | 0.8 |
| 13 | Big Sandy | 0.3 |
| 14 | Imperial Valley/Salton Sea | 0.3 |
U.S. Lithium Opportunities, By State
U.S. lithium projects mainly exist in western states, with comparatively minor opportunities in central or eastern states.
| State | LCE, million metric tons (est.) |
|---|---|
| Nevada | 88.2 |
| Arkansas | 4.6 |
| Arizona | 2.5 |
| California | 0.3 |
Currently, the U.S. is sitting on a wealth of lithium that it is underutilizing. For context, in 2022, the U.S. only produced about 5,000 metric tons of LCE and imported a projected 19,000 metric tons of LCE, showing that the demand for the mineral is healthy.
The Next Gold Rush?
U.S. lithium companies have the opportunity to become global leaders in lithium production and accelerate the transition to sustainable energy sources. This is particularly important as the demand for lithium is increasing every year.
EnergyX is on a mission to meet U.S. lithium demands using groundbreaking technology that can extract 300% more lithium from a source than traditional methods.
You can take advantage of this opportunity by investing in EnergyX and joining other significant players like GM in becoming a shareholder.


-

 Electrification3 years ago
Ranked: The Top 10 EV Battery Manufacturers
-

 Electrification2 years ago
The Key Minerals in an EV Battery
-

 Real Assets3 years ago
The World’s Top 10 Gold Mining Companies
-

 Misc3 years ago
All the Metals We Mined in One Visualization
-

 Electrification3 years ago
The Biggest Mining Companies in the World in 2021
-

 Energy Shift2 years ago
What Are the Five Major Types of Renewable Energy?
-

 Electrification2 years ago
The World’s Largest Nickel Mining Companies
-

 Electrification2 years ago
Mapped: Solar Power by Country in 2021