

Electrification
How EV Adoption Will Impact Oil Consumption (2015-2025P)
The EV Impact on Oil Consumption
As the world moves towards the electrification of the transportation sector, demand for oil will be replaced by demand for electricity.
To highlight the EV impact on oil consumption, the above infographic shows how much oil has been and will be saved every day between 2015 and 2025 by various types of electric vehicles, according to BloombergNEF.
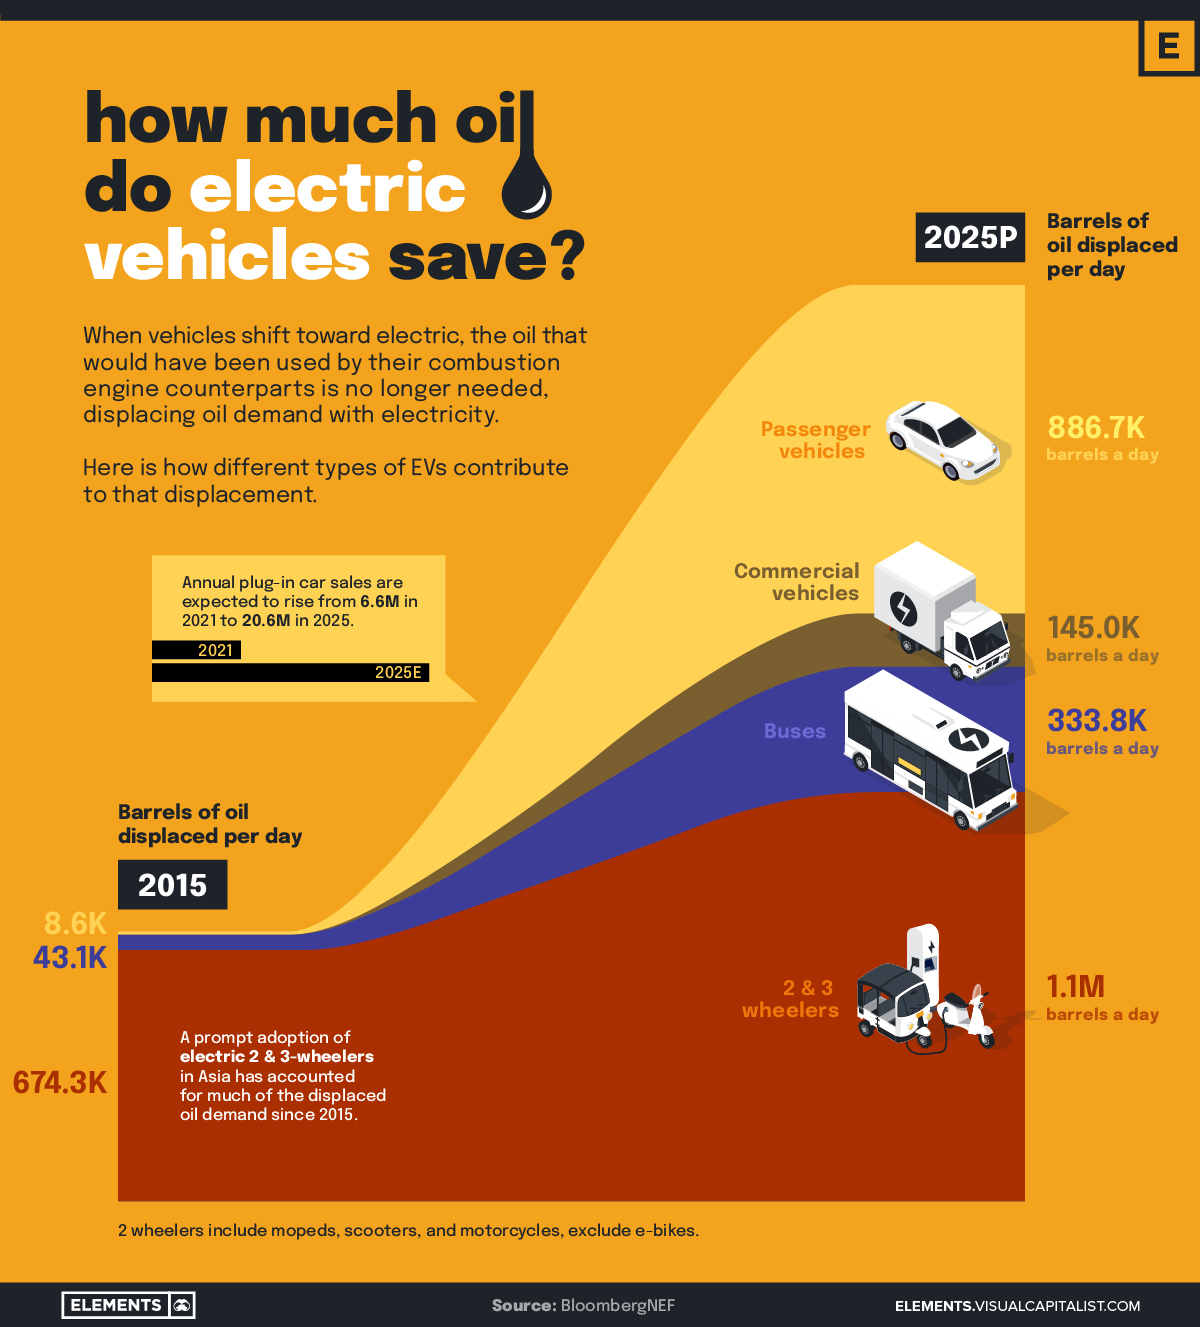
How Much Oil Do Electric Vehicles Save?
A standard combustion engine passenger vehicle in the U.S. uses about 10 barrels of oil equivalent (BOE) per year. A motorcycle uses 1, a Class 8 truck about 244, and a bus uses more than 276 BOEs per year.
When these vehicles become electrified, the oil their combustion engine counterparts would have used is no longer needed, displacing oil demand with electricity.
Since 2015, two and three-wheeled vehicles, such as mopeds, scooters, and motorcycles, have accounted for most of the oil saved from EVs on a global scale. With a wide adoption in Asia specifically, these vehicles displaced the demand for almost 675,000 barrels of oil per day in 2015. By 2021, this number had quickly grown to 1 million barrels per day.
Let’s take a look at the daily displacement of oil demand by EV segment.
| Number of barrels saved per day, 2015 | Number of barrels saved per day, 2025P | |
|---|---|---|
| Electric Passenger Vehicles | 8,600 | 886,700 |
| Electric Commercial Vehicles | 0 | 145,000 |
| Electric Buses | 43,100 | 333,800 |
| Electric Two & Three-Wheelers | 674,300 | 1,100,000 |
| Total Oil Barrels Per Day | 726,000 | 2,465,500 |
Today, while work is being done in the commercial vehicle segment, very few large trucks on the road are electric—however, this is expected to change by 2025.
Meanwile, electric passenger vehicles have shown the biggest growth in adoption since 2015.
In 2022, the electric car market experienced exponential growth, with sales exceeding 10 million cars. The market is expected to continue its strong growth throughout 2023 and beyond, eventually coming to save a predicted 886,700 barrels of oil per day in 2025.
From Gas to Electric
While the world shifts from fossil fuels to electricity, BloombergNEF predicts that the decline in oil demand does not necessarily equate to a drop in oil prices.
In the event that investments in new supply capacity decrease more rapidly than demand, oil prices could still remain unstable and high.
The shift toward electrification, however, will likely have other implications.
While most of us associate electric vehicles with lower emissions, it’s good to consider that they are only as sustainable as the electricity used to charge them. The shift toward electrification, then, presents an incredible opportunity to meet the growing demand for electricity with clean energy sources, such as wind, solar and nuclear power.
The shift away from fossil fuels in road transport will also require expanded infrastructure. EV charging stations, expanded transmission capacity, and battery storage will likely all be key to supporting the wide-scale transition from gas to electricity.


Electrification
Ranked: The Top 10 EV Battery Manufacturers in 2023
Asia dominates this ranking of the world’s largest EV battery manufacturers in 2023.

The Top 10 EV Battery Manufacturers in 2023
This was originally posted on our Voronoi app. Download the app for free on iOS or Android and discover incredible data-driven charts from a variety of trusted sources.
Despite efforts from the U.S. and EU to secure local domestic supply, all major EV battery manufacturers remain based in Asia.
In this graphic we rank the top 10 EV battery manufacturers by total battery deployment (measured in megawatt-hours) in 2023. The data is from EV Volumes.
Chinese Dominance
Contemporary Amperex Technology Co. Limited (CATL) has swiftly risen in less than a decade to claim the title of the largest global battery group.
The Chinese company now has a 34% share of the market and supplies batteries to a range of made-in-China vehicles, including the Tesla Model Y, SAIC’s MG4/Mulan, and Li Auto models.
| Company | Country | 2023 Production (megawatt-hour) | Share of Total Production |
|---|---|---|---|
| CATL | 🇨🇳China | 242,700 | 34% |
| BYD | 🇨🇳China | 115,917 | 16% |
| LG Energy Solution | 🇰🇷Korea | 108,487 | 15% |
| Panasonic | 🇯🇵Japan | 56,560 | 8% |
| SK On | 🇰🇷Korea | 40,711 | 6% |
| Samsung SDI | 🇰🇷Korea | 35,703 | 5% |
| CALB | 🇨🇳China | 23,493 | 3% |
| Farasis Energy | 🇨🇳China | 16,527 | 2% |
| Envision AESC | 🇨🇳China | 8,342 | 1% |
| Sunwoda | 🇨🇳China | 6,979 | 1% |
| Other | - | 56,040 | 8% |
In 2023, BYD surpassed LG Energy Solution to claim second place. This was driven by demand from its own models and growth in third-party deals, including providing batteries for the made-in-Germany Tesla Model Y, Toyota bZ3, Changan UNI-V, Venucia V-Online, as well as several Haval and FAW models.
The top three battery makers (CATL, BYD, LG) collectively account for two-thirds (66%) of total battery deployment.
Once a leader in the EV battery business, Panasonic now holds the fourth position with an 8% market share, down from 9% last year. With its main client, Tesla, now effectively sourcing batteries from multiple suppliers, the Japanese battery maker seems to be losing its competitive edge in the industry.
Overall, the global EV battery market size is projected to grow from $49 billion in 2022 to $98 billion by 2029, according to Fortune Business Insights.
Electrification
White Gold: Mapping U.S. Lithium Mines
In this graphic, Visual Capitalist partnerered with EnergyX to explore the size and location of U.S. lithium mines.

White Gold: Mapping U.S. Lithium Mines
The U.S. doubled imports of lithium-ion batteries for the third consecutive year in 2022, and with EV demand growing yearly, U.S. lithium mines must ramp up production or rely on other nations for their supply of refined lithium.
To determine if the domestic U.S. lithium opportunity can meet demand, we partnered with EnergyX to determine how much lithium sits within U.S. borders.
U.S. Lithium Projects
The most crucial measure of a lithium mine’s potential is the quantity that can be extracted from the source.
For each lithium resource, the potential volume of lithium carbonate equivalent (LCE) was calculated with a ratio of one metric ton of lithium producing 5.32 metric tons of LCE. Cumulatively, existing U.S. lithium projects contain 94.8 million metric tons of LCE.
| Rank | Project Name | LCE, million metric tons (est.) |
|---|---|---|
| 1 | McDermitt Caldera | 21.5 |
| 2 | Thacker Pass | 19.1 |
| 3 | Tonopah Flats | 18.0 |
| 4 | TLC Lithium | 10.7 |
| 5 | Clayton Valley (Century Lithium) | 6.3 |
| 6 | Zeus Lithium | 6.3 |
| 7 | Rhyolite Ridge | 3.4 |
| 8 | Arkansas Smackover (Phase 1A) | 2.8 |
| 9 | Basin Project | 2.2 |
| 10 | McGee Deposit | 2.1 |
| 11 | Arkansas Smackover (South West) | 1.8 |
| 12 | Clayton Valley (Lithium-X, Pure Energy) | 0.8 |
| 13 | Big Sandy | 0.3 |
| 14 | Imperial Valley/Salton Sea | 0.3 |
U.S. Lithium Opportunities, By State
U.S. lithium projects mainly exist in western states, with comparatively minor opportunities in central or eastern states.
| State | LCE, million metric tons (est.) |
|---|---|
| Nevada | 88.2 |
| Arkansas | 4.6 |
| Arizona | 2.5 |
| California | 0.3 |
Currently, the U.S. is sitting on a wealth of lithium that it is underutilizing. For context, in 2022, the U.S. only produced about 5,000 metric tons of LCE and imported a projected 19,000 metric tons of LCE, showing that the demand for the mineral is healthy.
The Next Gold Rush?
U.S. lithium companies have the opportunity to become global leaders in lithium production and accelerate the transition to sustainable energy sources. This is particularly important as the demand for lithium is increasing every year.
EnergyX is on a mission to meet U.S. lithium demands using groundbreaking technology that can extract 300% more lithium from a source than traditional methods.
You can take advantage of this opportunity by investing in EnergyX and joining other significant players like GM in becoming a shareholder.


-

 Electrification3 years ago
Ranked: The Top 10 EV Battery Manufacturers
-

 Electrification2 years ago
The Key Minerals in an EV Battery
-

 Real Assets3 years ago
The World’s Top 10 Gold Mining Companies
-

 Misc3 years ago
All the Metals We Mined in One Visualization
-

 Electrification3 years ago
The Biggest Mining Companies in the World in 2021
-

 Energy Shift2 years ago
What Are the Five Major Types of Renewable Energy?
-

 Electrification2 years ago
The World’s Largest Nickel Mining Companies
-

 Electrification2 years ago
Mapped: Solar Power by Country in 2021