

Energy Shift
The Power of a Uranium Pellet
The Energy Efficiency of a Uranium Pellet
Nuclear energy’s incredible efficiency and powerful nature comes from uranium’s high energy density.
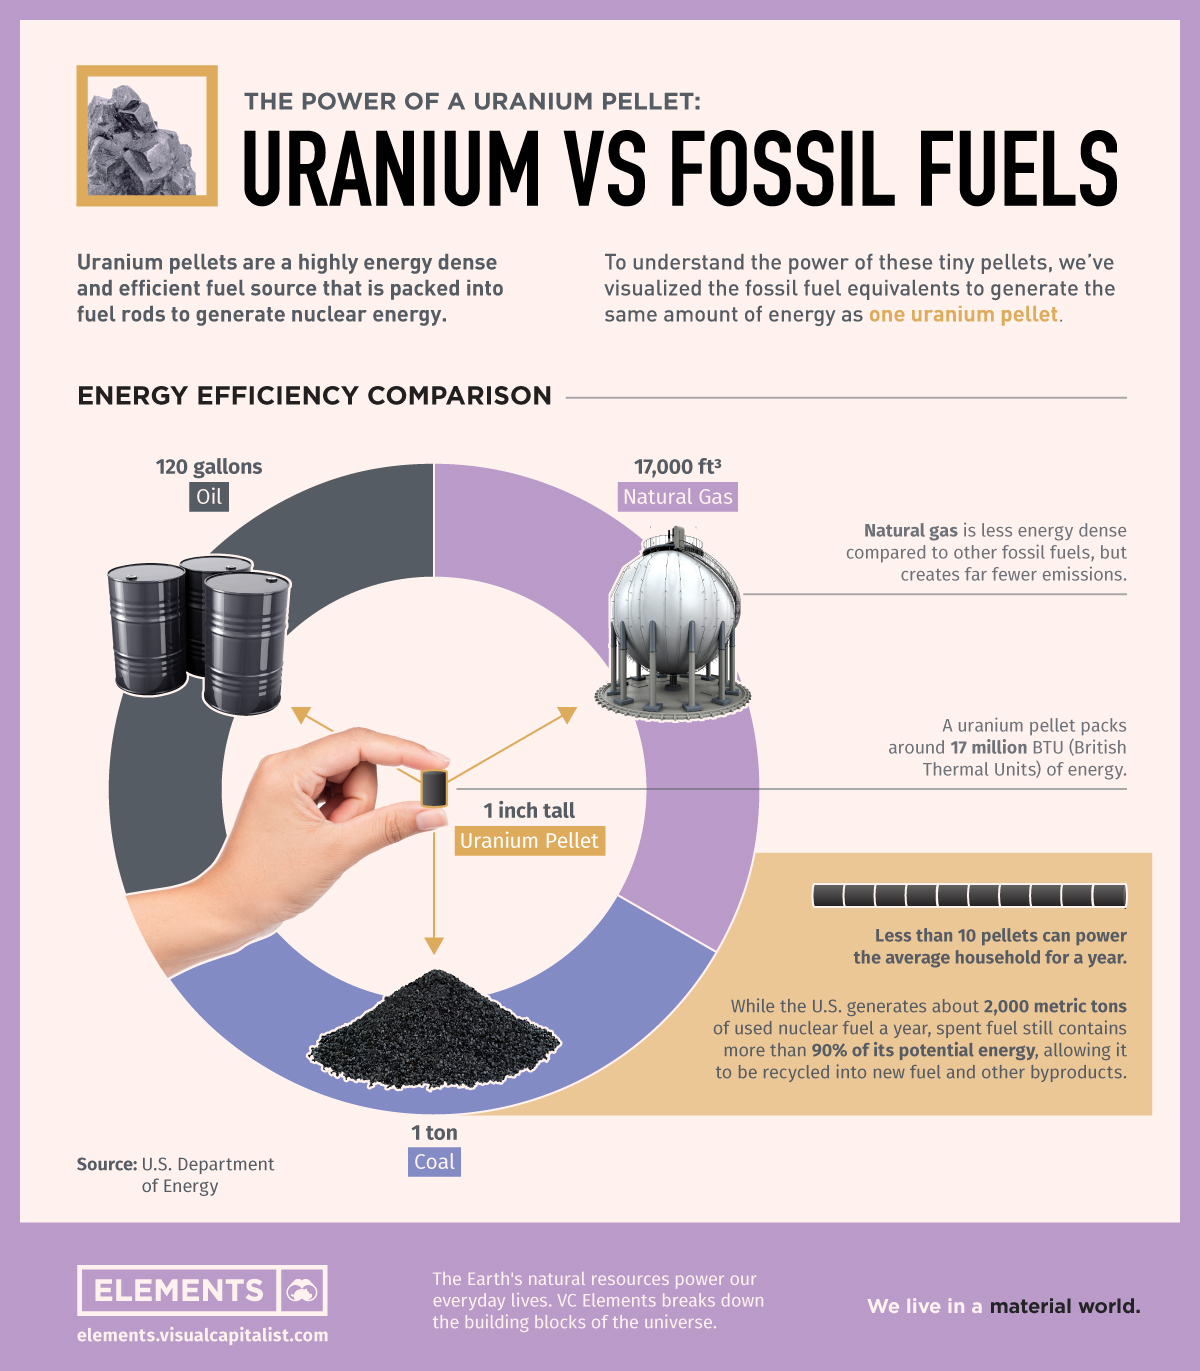
It is the most energy dense and efficient fuel source we have, with just ten uranium pellets able to power the average household for an entire year.
Using research from the U.S. Department of Energy, this graphic puts in perspective the efficiency of a single uranium pellet in comparison to fossil fuels.
Uranium’s Energy Density vs. Fossil Fuels
Uranium’s energy efficiency comes from it’s highly dense atomic and material nature, which is split apart when nuclear fission occurs.
It is the second-heaviest metal in terms of relative atomic mass, and is also one of the densest at around 19 g/cm3. For context, a gallon of milk weighs around 8 lbs, while a same-sized container of uranium would weigh around 150 lbs.
In the process of nuclear fission, the U-235 isotope of uranium is hit by a moving neutron and splits in two. This splitting of the atom produces heat energy and releases more neutrons that hit other U-235 atoms, causing a chain reaction of nuclear fission.
The energy generated by the fission of a single uranium pellet is equivalent to:
- 1 ton of coal or
- 120 gallons of crude oil or
- 17,000 ft3 of natural gas
With about 17 million British Thermal Units (BTU) worth of energy in a uranium pellet, it’s no wonder that many are now looking at nuclear energy as a key piece to the clean energy puzzle.
Not Just Better than Fossil Fuels
Nuclear power isn’t just an improvement over fossil fuels, it also beats out renewable energy sources in a few other key areas. Along with low lifecycle emissions, nuclear power also has a low land footprint and the highest reliability compared to other sustainable energy sources.
1. CO2 Lifecycle Emissions
As a non-fossil fuel source of energy, nuclear power has one of the lowest average life cycle CO2 emissions among energy technologies. Since 1970, nuclear power plants have reduced over 60 gigatonnes of CO2 emissions, and have lower average life cycle emissions compared to solar panels, geothermal energy, and hydropower.
2. Land Footprint
While reducing carbon emissions is great, renewable energy sources are also judged on their land footprint. Nuclear power has one of the lowest land footprints per 1,000 megawatts of electricity a year at 1.3 square miles. In comparison, for the same amount of energy solar power requires ~75x more surface area, and wind power requires ~360x more surface area.
3. Power Generation Uptime
The power generation uptime of energy sources is another important metric to measure their reliability and efficiency. Nuclear power plants have the best uptime of all energy sources, running at maximum capacity 92.5% of the year. In comparison, the two next best energy sources in terms of reliability are geothermal energy (74.3%) and natural gas (56.6%).
Nuclear Energy’s Water Usage and Waste Disposal
Although nuclear energy is incredibly efficient and much cleaner than fossil fuels, it still isn’t quite a perfect energy solution.
Nuclear power plants rely on large amounts of water especially for their cooling operations, which is why many are located near bodies of water. When compared with other energy sources, many estimates find that nuclear power plants typically consume the most water when using cooling towers.
| Energy source | Gallons of water per megawatt-hour of electricity produced |
|---|---|
| Nuclear | 1,101 gal |
| Coal | 1,005 gal |
| Concentrated solar | 906 gal |
| Biomass | 878 gal |
| Natural gas | 255 gal |
| Geothermal | 15 gal |
Source: Median figures of Macknick et al/Environmental Research Letters
Along with their water consumption, nuclear power plants also produce nuclear waste which must safely removed and stored in a permanent disposal site.
While countries like France, Germany, and Japan recycle the majority of their spent fuel, the U.S. currently treats it as waste. This results in the spent uranium fuel needing to be cooled for 2-5 years, with the most common cooling method requiring even more water consumption.
Uranium’s Future as the World’s Energy Fuel
While uranium offers an incredible amount of energy in a tiny package, nuclear power is still working to shake off the shadows of past incidents like Fukushima, Three Mile Island, and Chernobyl. Despite this, nuclear still is an incredibly safe energy source compared to fossil fuels, and safety improvements continue to be invested in and researched today.
Nuclear energy is also receiving a fiscal boost in the United States, with the recent infrastructure bill passed by the senate providing funding for two commercial-scale demonstration projects. Just as important, the bill also mentions that when determining whether to certify a reactor, priority will be given to reactors that use uranium that is produced and enriched domestically.
As the world continues working to reduce carbon emissions, people are starting to recognize that uranium’s energy efficiency could be vital in weaning the world off of fossil fuel dependence.


Energy Shift
The World’s Biggest Oil Producers in 2023
Just three countries accounted for 40% of global oil production last year.

The World’s Biggest Oil Producers in 2023
This was originally posted on our Voronoi app. Download the app for free on iOS or Android and discover incredible data-driven charts from a variety of trusted sources.
Despite efforts to decarbonize the global economy, oil still remains one of the world’s most important resources. It’s also produced by a fairly limited group of countries, which can be a source of economic and political leverage.
This graphic illustrates global crude oil production in 2023, measured in million barrels per day, sourced from the U.S. Energy Information Administration (EIA).
Three Countries Account for 40% of Global Oil Production
In 2023, the United States, Russia, and Saudi Arabia collectively contributed 32.7 million barrels per day to global oil production.
| Oil Production 2023 | Million barrels per day |
|---|---|
| 🇺🇸 U.S. | 12.9 |
| 🇷🇺 Russia | 10.1 |
| 🇸🇦 Saudi Arabia | 9.7 |
| 🇨🇦 Canada | 4.6 |
| 🇮🇶 Iraq | 4.3 |
| 🇨🇳 China | 4.2 |
| 🇮🇷 Iran | 3.6 |
| 🇧🇷 Brazil | 3.4 |
| 🇦🇪 UAE | 3.4 |
| 🇰🇼 Kuwait | 2.7 |
| 🌍 Other | 22.8 |
These three nations have consistently dominated oil production since 1971. The leading position, however, has alternated among them over the past five decades.
In contrast, the combined production of the next three largest producers—Canada, Iraq, and China—reached 13.1 million barrels per day in 2023, just surpassing the production of the United States alone.
In the near term, no country is likely to surpass the record production achieved by the U.S. in 2023, as no other producer has ever reached a daily capacity of 13.0 million barrels. Recently, Saudi Arabia’s state-owned Saudi Aramco scrapped plans to increase production capacity to 13.0 million barrels per day by 2027.
In 2024, analysts forecast that the U.S. will maintain its position as the top oil producer. In fact, according to Macquarie Group, U.S. oil production is expected to achieve a record pace of about 14 million barrels per day by the end of the year.
Energy Shift
How Much Does the U.S. Depend on Russian Uranium?
Despite a new uranium ban being discussed in Congress, the U.S. is still heavily dependent on Russian uranium.

How Much Does the U.S. Depend on Russian Uranium?
This was originally posted on our Voronoi app. Download the app for free on iOS or Android and discover incredible data-driven charts from a variety of trusted sources.
The U.S. House of Representatives recently passed a ban on imports of Russian uranium. The bill must pass the Senate before becoming law.
In this graphic, we visualize how much the U.S. relies on Russian uranium, based on data from the United States Energy Information Administration (EIA).
U.S. Suppliers of Enriched Uranium
After Russia invaded Ukraine, the U.S. imposed sanctions on Russian-produced oil and gas—yet Russian-enriched uranium is still being imported.
Currently, Russia is the largest foreign supplier of nuclear power fuel to the United States. In 2022, Russia supplied almost a quarter of the enriched uranium used to fuel America’s fleet of more than 90 commercial reactors.
| Country of enrichment service | SWU* | % |
|---|---|---|
| 🇺🇸 United States | 3,876 | 27.34% |
| 🇷🇺 Russia | 3,409 | 24.04% |
| 🇩🇪 Germany | 1,763 | 12.40% |
| 🇬🇧 United Kingdom | 1,593 | 11.23% |
| 🇳🇱 Netherlands | 1,303 | 9.20% |
| Other | 2,232 | 15.79% |
| Total | 14,176 | 100% |
SWU stands for “Separative Work Unit” in the uranium industry. It is a measure of the amount of work required to separate isotopes of uranium during the enrichment process. Source: U.S. Energy Information Administration
Most of the remaining uranium is imported from European countries, while another portion is produced by a British-Dutch-German consortium operating in the United States called Urenco.
Similarly, nearly a dozen countries around the world depend on Russia for more than half of their enriched uranium—and many of them are NATO-allied members and allies of Ukraine.
In 2023 alone, the U.S. nuclear industry paid over $800 million to Russia’s state-owned nuclear energy corporation, Rosatom, and its fuel subsidiaries.
It is important to note that 19% of electricity in the U.S. is powered by nuclear plants.
The dependency on Russian fuels dates back to the 1990s when the United States turned away from its own enrichment capabilities in favor of using down-blended stocks of Soviet-era weapons-grade uranium.
As part of the new uranium-ban bill, the Biden administration plans to allocate $2.2 billion for the expansion of uranium enrichment facilities in the United States.

-

 Electrification3 years ago
Ranked: The Top 10 EV Battery Manufacturers
-

 Electrification2 years ago
The Key Minerals in an EV Battery
-

 Real Assets3 years ago
The World’s Top 10 Gold Mining Companies
-

 Misc3 years ago
All the Metals We Mined in One Visualization
-

 Electrification3 years ago
The Biggest Mining Companies in the World in 2021
-

 Energy Shift2 years ago
What Are the Five Major Types of Renewable Energy?
-

 Electrification2 years ago
Mapped: Solar Power by Country in 2021
-

 Electrification2 years ago
The World’s Largest Nickel Mining Companies