

Energy Shift
The Countries Buying Russian Fossil Fuels Since the Invasion
The Countries Buying Russian Fossil Fuels Since the Invasion
A year on from Russia’s initial invasion of Ukraine, Russian fossil fuel exports are still flowing to various nations around the world.
According to estimates from the Centre for Research on Energy and Clean Air (CREA), since the invasion started about a year ago, Russia has made more than $315 billion in revenue from fossil fuel exports around the world, with nearly half ($149 billion) coming from EU nations.
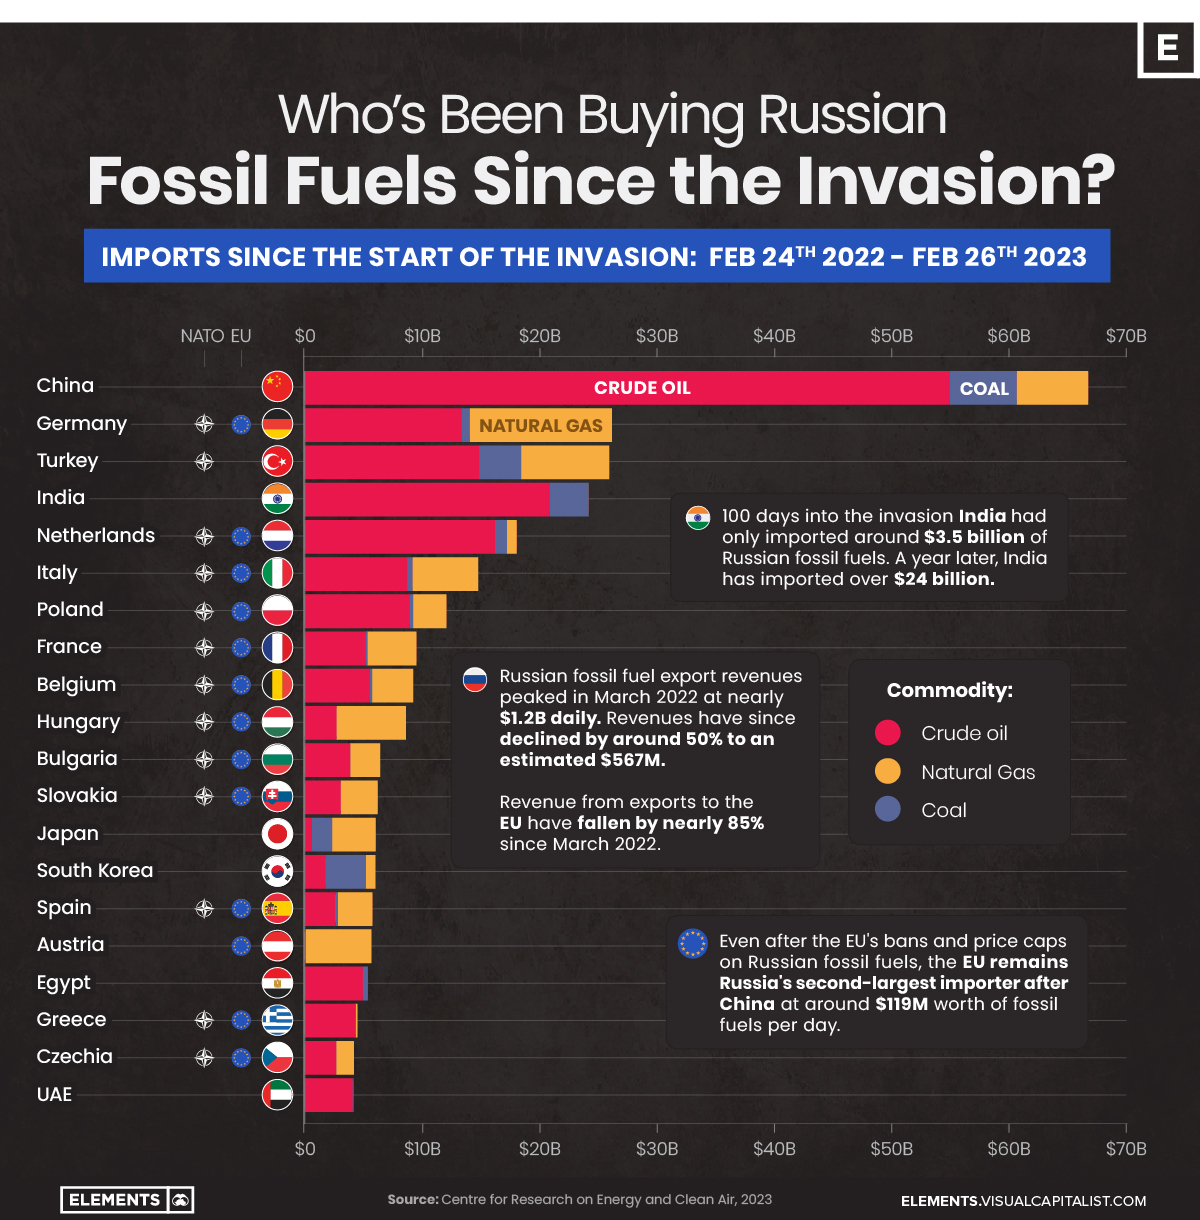
This graphic uses data from the CREA to visualize the countries that have bought the most Russian fossil fuels since the invasion, showcasing the billions in revenue Russia has made from these exports.
Top Importers of Russian Fossil Fuels
As one might expect, China has been the top buyer of Russian fossil fuels since the start of the invasion. Russia’s neighbor and informal ally has primarily imported crude oil, which has made up more than 80% of its imports totaling more than $55 billion since the start of the invasion.
The EU’s largest economy, Germany, is the second-largest importer of Russian fossil fuels, largely due to its natural gas imports worth more than $12 billion alone.
| Country | Total Value of Russian Fossil Fuel Imports* | Crude Oil | Natural Gas | Coal |
|---|---|---|---|---|
| 🇨🇳 China | $66.6B | $54.9B | $6.1B | $5.7B |
| 🇩🇪 Germany | $26.1B | $13.3B | $12.1B | $0.7B |
| 🇹🇷 Turkey | $25.9B | $14.8B | $7.5B | $3.6B |
| 🇮🇳 India | $24.1B | $20.8B | $0 | $3.3B |
| 🇳🇱 Netherlands | $18.0B | $16.2B | $0.8B | $1.0B |
| 🇮🇹 Italy | $14.8B | $8.7B | $5.6B | $0.4B |
| 🇵🇱 Poland | $12.1B | $8.9B | $2.9B | $0.3B |
| 🇫🇷 France | $9.5B | $5.2B | $4.2B | $0.2B |
| 🇧🇪 Belgium | $9.2B | $5.5B | $3.5B | $0.2B |
| 🇭🇺 Hungary | $8.6B | $2.7B | $5.9B | $0 |
| 🇧🇬 Bulgaria | $6.4B | $3.9B | $2.5B | $0 |
| 🇸🇰 Slovakia | $6.2B | $3.1B | $3.1B | $0 |
| 🇯🇵 Japan | $6.0B | $0.6B | $3.7B | $1.7B |
| 🇰🇷 South Korea | $6.0B | $1.8B | $0.8B | $3.5B |
| 🇪🇸 Spain | $5.8B | $2.7B | $2.9B | $0.2B |
| 🇦🇹 Austria | $5.7B | $0.1B | $5.6B | $0 |
| 🇪🇬 Egypt | $5.4B | $4.9B | $0 | $0.4B |
| 🇬🇷 Greece | $4.5B | $4.3B | $0.2B | $0 |
| 🇨🇿 Czechia | $4.2B | $2.7B | $1.5B | $0 |
| 🇦🇪 UAE | $4.1B | $4.1B | $0 | $0.1B |
*Over the time period of Feb 24, 2022 to Feb 26, 2023 in U.S. dollars
Turkey, a member of NATO but not of the EU, closely follows Germany as the third-largest importer of Russian fossil fuels since the invasion. The country is likely to overtake Germany soon, as not being part of the EU means it isn’t affected by the bloc’s Russian import bans put in place over the last year.
Although more than half of the top 20 fossil fuel importing nations are from the EU, nations from the bloc and the rest of Europe have been curtailing their imports as bans and price caps on Russian coal imports, crude oil seaborne shipments, and petroleum product imports have come into effect.
Russia’s Declining Fossil Fuel Revenues
The EU’s bans and price caps have resulted in a decline of daily fossil fuel revenues from the bloc of nearly 85%, falling from their March 2022 peak of $774 million per day to $119 million as of February 22nd, 2023.
Although India has stepped up its fossil fuel imports in the meantime, from $3 million daily on the day of the invasion to $81 million per day as of February 22nd of this year, this increase doesn’t come close to making up the $655 million hole left by EU nations’ reduction in imports.
Similarly, even if African nations have doubled their Russian fuel imports since December of last year, Russian seaborne oil product exports have still declined by 21% overall since January according to S&P Global.
Other Factors Impacting Revenues
Overall, from their peak on March 24th of around $1.17 billion in daily revenue, Russian fossil fuel revenues have declined by more than 50% to just $560 million daily.
Along with the EU’s reductions in purchases, a key contributing factor has been the decline in Russian crude oil’s price, which has also declined by nearly 50% since the invasion, from $99 a barrel to $50 a barrel today.
Whether these declines will continue is yet to be determined. That said, the EU’s 10th set of sanctions, announced on February 25th, ban the import of bitumen, related materials like asphalt, synthetic rubbers, and carbon blacks and are estimated to reduce overall Russian export revenues by almost $1.4 billion.


Energy Shift
The World’s Biggest Oil Producers in 2023
Just three countries accounted for 40% of global oil production last year.

The World’s Biggest Oil Producers in 2023
This was originally posted on our Voronoi app. Download the app for free on iOS or Android and discover incredible data-driven charts from a variety of trusted sources.
Despite efforts to decarbonize the global economy, oil still remains one of the world’s most important resources. It’s also produced by a fairly limited group of countries, which can be a source of economic and political leverage.
This graphic illustrates global crude oil production in 2023, measured in million barrels per day, sourced from the U.S. Energy Information Administration (EIA).
Three Countries Account for 40% of Global Oil Production
In 2023, the United States, Russia, and Saudi Arabia collectively contributed 32.7 million barrels per day to global oil production.
| Oil Production 2023 | Million barrels per day |
|---|---|
| 🇺🇸 U.S. | 12.9 |
| 🇷🇺 Russia | 10.1 |
| 🇸🇦 Saudi Arabia | 9.7 |
| 🇨🇦 Canada | 4.6 |
| 🇮🇶 Iraq | 4.3 |
| 🇨🇳 China | 4.2 |
| 🇮🇷 Iran | 3.6 |
| 🇧🇷 Brazil | 3.4 |
| 🇦🇪 UAE | 3.4 |
| 🇰🇼 Kuwait | 2.7 |
| 🌍 Other | 22.8 |
These three nations have consistently dominated oil production since 1971. The leading position, however, has alternated among them over the past five decades.
In contrast, the combined production of the next three largest producers—Canada, Iraq, and China—reached 13.1 million barrels per day in 2023, just surpassing the production of the United States alone.
In the near term, no country is likely to surpass the record production achieved by the U.S. in 2023, as no other producer has ever reached a daily capacity of 13.0 million barrels. Recently, Saudi Arabia’s state-owned Saudi Aramco scrapped plans to increase production capacity to 13.0 million barrels per day by 2027.
In 2024, analysts forecast that the U.S. will maintain its position as the top oil producer. In fact, according to Macquarie Group, U.S. oil production is expected to achieve a record pace of about 14 million barrels per day by the end of the year.
Energy Shift
How Much Does the U.S. Depend on Russian Uranium?
Despite a new uranium ban being discussed in Congress, the U.S. is still heavily dependent on Russian uranium.

How Much Does the U.S. Depend on Russian Uranium?
This was originally posted on our Voronoi app. Download the app for free on iOS or Android and discover incredible data-driven charts from a variety of trusted sources.
The U.S. House of Representatives recently passed a ban on imports of Russian uranium. The bill must pass the Senate before becoming law.
In this graphic, we visualize how much the U.S. relies on Russian uranium, based on data from the United States Energy Information Administration (EIA).
U.S. Suppliers of Enriched Uranium
After Russia invaded Ukraine, the U.S. imposed sanctions on Russian-produced oil and gas—yet Russian-enriched uranium is still being imported.
Currently, Russia is the largest foreign supplier of nuclear power fuel to the United States. In 2022, Russia supplied almost a quarter of the enriched uranium used to fuel America’s fleet of more than 90 commercial reactors.
| Country of enrichment service | SWU* | % |
|---|---|---|
| 🇺🇸 United States | 3,876 | 27.34% |
| 🇷🇺 Russia | 3,409 | 24.04% |
| 🇩🇪 Germany | 1,763 | 12.40% |
| 🇬🇧 United Kingdom | 1,593 | 11.23% |
| 🇳🇱 Netherlands | 1,303 | 9.20% |
| Other | 2,232 | 15.79% |
| Total | 14,176 | 100% |
SWU stands for “Separative Work Unit” in the uranium industry. It is a measure of the amount of work required to separate isotopes of uranium during the enrichment process. Source: U.S. Energy Information Administration
Most of the remaining uranium is imported from European countries, while another portion is produced by a British-Dutch-German consortium operating in the United States called Urenco.
Similarly, nearly a dozen countries around the world depend on Russia for more than half of their enriched uranium—and many of them are NATO-allied members and allies of Ukraine.
In 2023 alone, the U.S. nuclear industry paid over $800 million to Russia’s state-owned nuclear energy corporation, Rosatom, and its fuel subsidiaries.
It is important to note that 19% of electricity in the U.S. is powered by nuclear plants.
The dependency on Russian fuels dates back to the 1990s when the United States turned away from its own enrichment capabilities in favor of using down-blended stocks of Soviet-era weapons-grade uranium.
As part of the new uranium-ban bill, the Biden administration plans to allocate $2.2 billion for the expansion of uranium enrichment facilities in the United States.

-

 Electrification3 years ago
Ranked: The Top 10 EV Battery Manufacturers
-

 Electrification2 years ago
The Key Minerals in an EV Battery
-

 Real Assets3 years ago
The World’s Top 10 Gold Mining Companies
-

 Misc3 years ago
All the Metals We Mined in One Visualization
-

 Electrification3 years ago
The Biggest Mining Companies in the World in 2021
-

 Energy Shift2 years ago
What Are the Five Major Types of Renewable Energy?
-

 Electrification2 years ago
Mapped: Solar Power by Country in 2021
-

 Electrification2 years ago
The World’s Largest Nickel Mining Companies