

This infographic visualizes the 2.8 billion tonnes of metals mined in 2022.
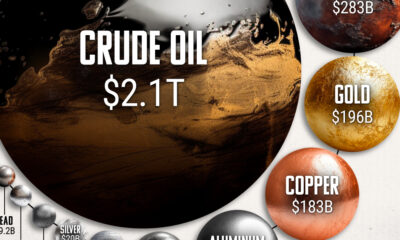

This infographic puts the oil market's size into perspective by comparing it to the top 10 metal markets.
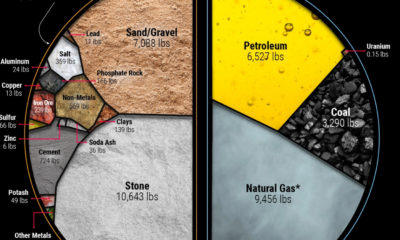

Wealthy countries consume large amounts of natural resources per capita, and the U.S. is no exception. See how much is used per person.
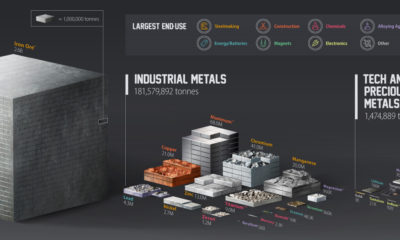

See the 2.8 billion tonnes of metals mined in 2021.
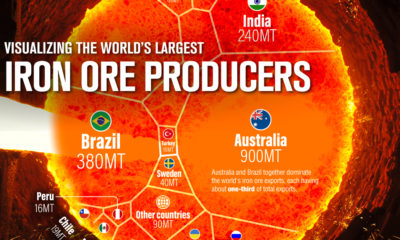

Iron ore made up 93% of the 2.7 billion tonnes of metals mined in 2021. This infographic lists the world’s largest iron ore producers.
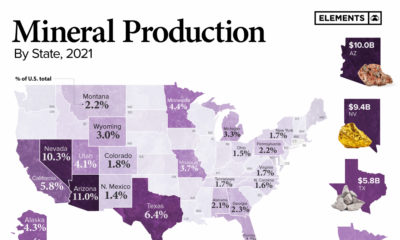

This infographic breaks down $90.4 billion in non-fuel mineral production by state.
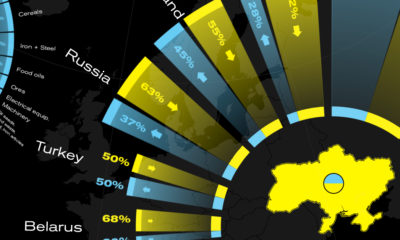

This graphic visualizes Ukraine's top international trading partners and the country's most exported and imported products in 2020.
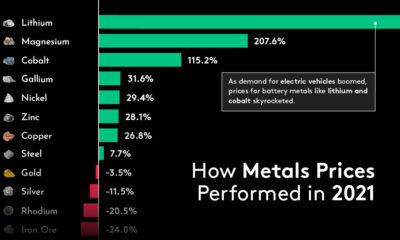

Metals mostly provided positive returns in 2021, with lithium and other industrial metals leading the charge while gold and silver slumped.


From iron ore to gold, over 3 billion tonnes of metals were mined in 2019. Which metals did miners produce?
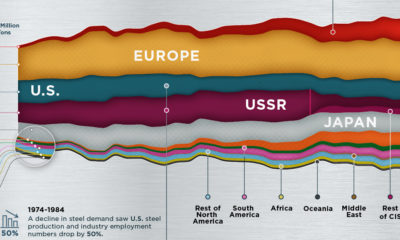

Global steel production has tripled over the past 50 years, with China's steel production eclipsing the rest of the world.


