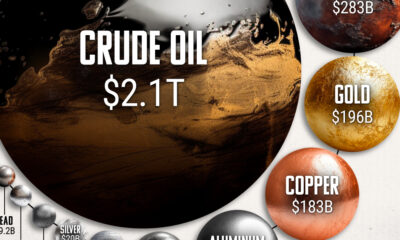

This infographic puts the oil market's size into perspective by comparing it to the top 10 metal markets.
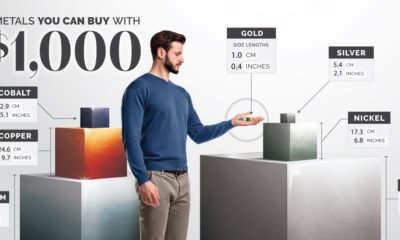

Curious how much of a metal you get for $1,000? This infographic compares the amount of precious and industrial metals worth $1,000.
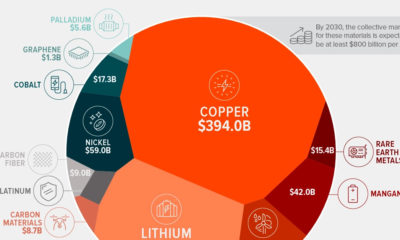

Disruptive materials are key inputs in emerging, next-generation technologies. See how the forecasted market value for these materials is expected to surge by billions in the...
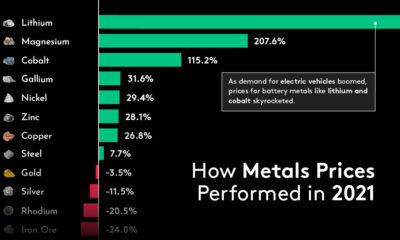

Metals mostly provided positive returns in 2021, with lithium and other industrial metals leading the charge while gold and silver slumped.


From iron ore to gold, over 3 billion tonnes of metals were mined in 2019. Which metals did miners produce?


The graphic takes a look at the world’s largest mining companies by market capitalization and the metals they produce.
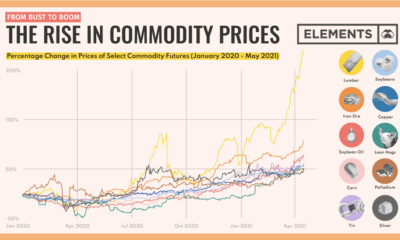

Commodity prices have been on the uptrend since 2020. This chart shows 10 commodities with significant price increases over the last year.
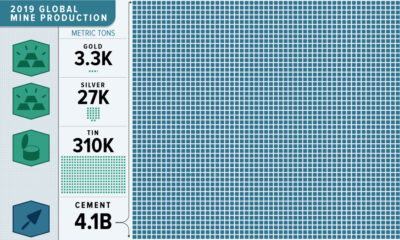

This massive infographic reveals the dramatic scale of 2019 non-fuel mineral global production.