

Misc
Visualizing the Rise in Commodity Prices
The Stuff that Makes Everything
If you ever wonder why commodities are important, just think of an object around you and ask yourself—what’s that made of?
From the wires in our electronic devices to the tables in our offices, these raw materials are everywhere. Of late, commodity prices have been surging as the global economy recovers, with rising demand from various industries including infrastructure, construction, and livestock.
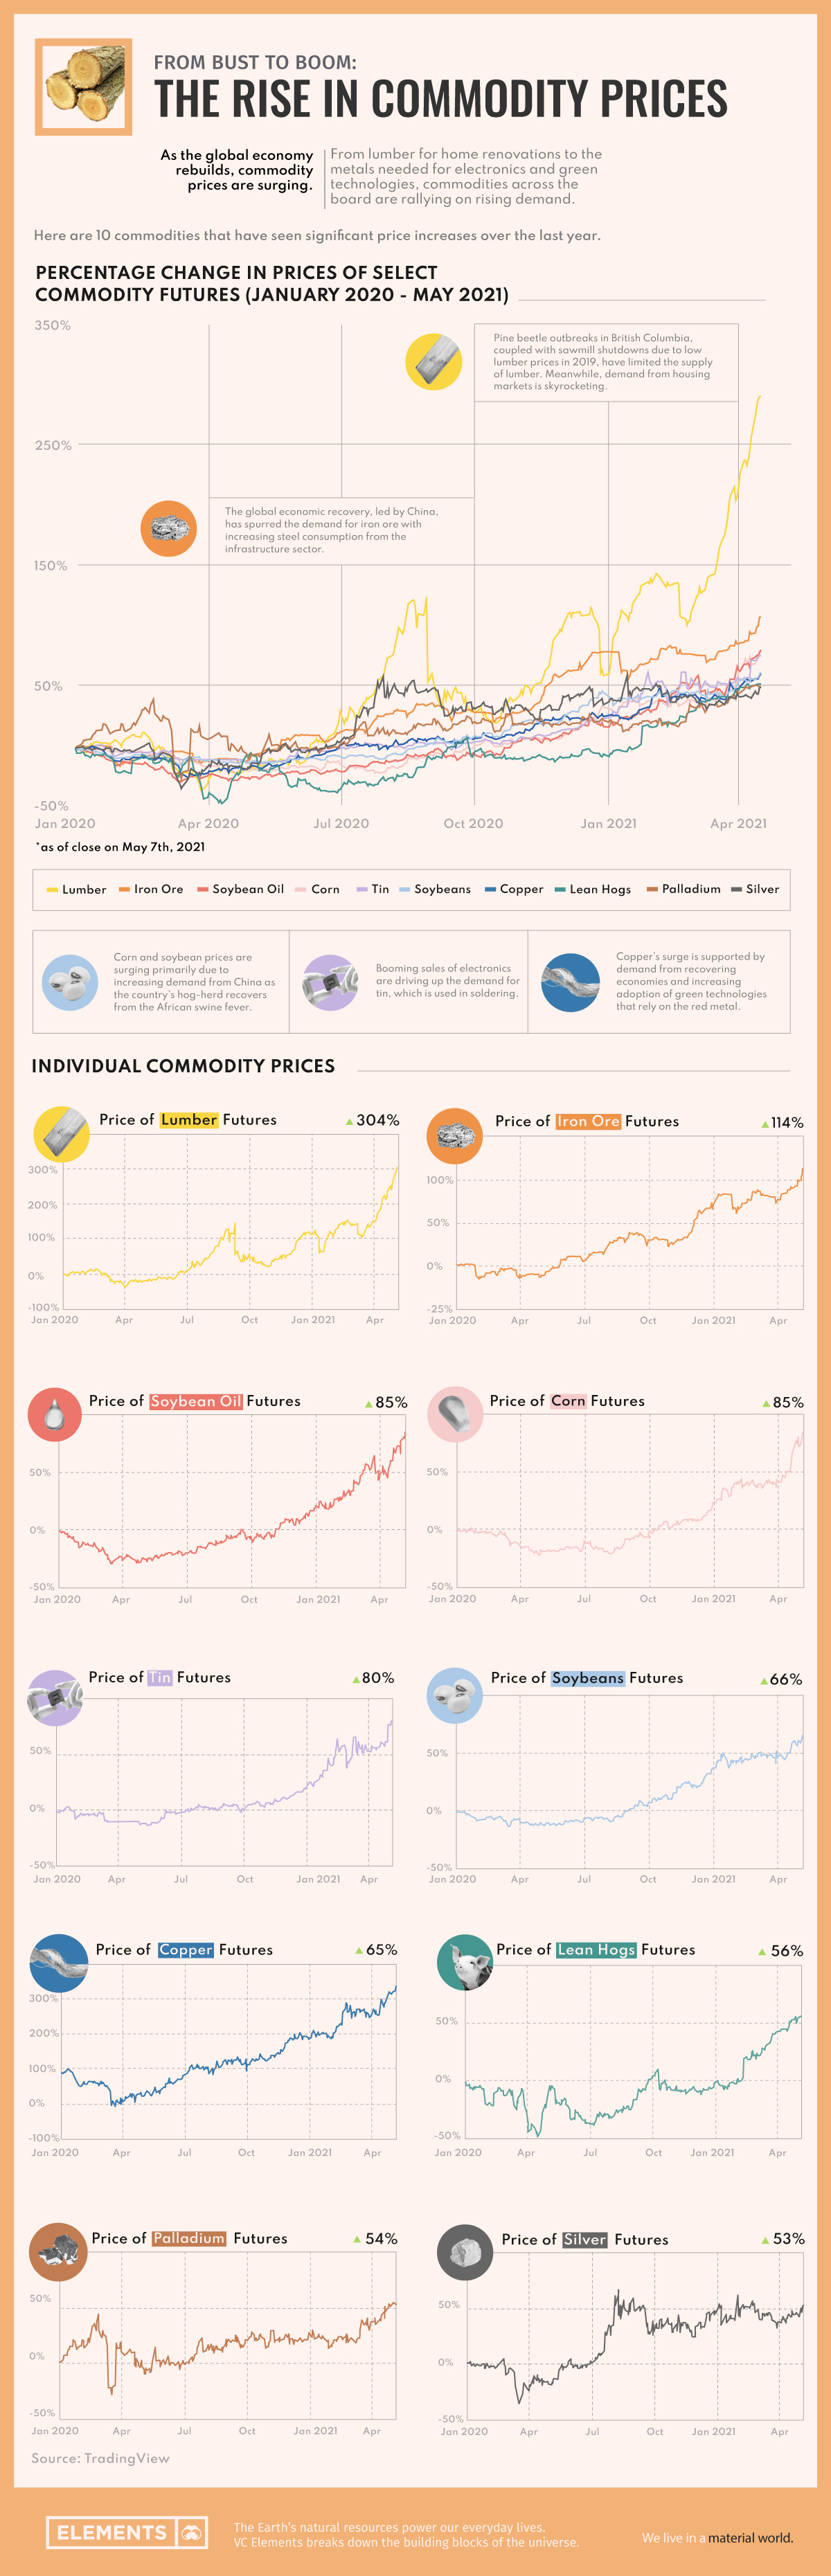
The above infographic tracks the futures prices of 10 commodities that have seen significant price increases since January 2020.
Commodity Prices, from Bust to Boom
From lumber for home construction to metals for electronics, commodities across the three categories—agriculture, metals, and energy—have been rallying since hitting pandemic lows around March 2020.
| Commodity | Closing Price (Jan 1, 2020) | Closing Price (May 7, 2020) | % Increase |
|---|---|---|---|
| Lumber | $406.7 per 1,000 board ft | $1,645 per 1,000 board ft | 304% |
| Iron Ore | $92.6 per tonne | $197.7 per tonne | 114% |
| Soybean Oil | $0.35 per lb | $0.65 per lb | 85% |
| Corn | $3.9 per bushel | $7.3 per bushel | 85% |
| Tin | $17,170 per tonne | $30,950 per tonne | 80% |
| Soybeans | $9.6 per bushel | $15.9 per bushel | 66% |
| Copper | $2.8 per lb | $4.6 per lb | 65% |
| Lean Hogs | $0.71 per lb | $1.1 per lb | 56% |
| Palladium | $1,928 per oz | $2,961.5 per oz | 54% |
| Silver | $18 per oz | $27.6 per oz | 53% |
Percentage increases may differ slightly due to rounding.
Among agricultural commodities, the price of lumber futures increased 304% between January 2020 and May 2021, reaching record highs. Food prices have also seen a sharp increase since the halfway point of last year. As of May 7th, the price of corn futures was at $7.3 per bushel, nearing its all-time highs of $8.3 per bushel in 2012. Furthermore, soybean oil prices were also at their highest level in the last decade.
Among metals, iron ore futures climbed 114%, reaching a record high. Tin and copper were also both moving towards all-time high prices as of May 7th, followed by palladium and silver, both of which saw more than a 50% rise in prices since January 2020.
Several commodities are either nearing or have broken past their all-time highs. Why are commodity prices increasing?
Lumber
Lumber—the form of wood that builders use to build and renovate homes—has been the talk of the town due to the massive increase in its price.
This is in stark contrast to 2019 when lumber prices were so low that some sawmill owners were better off ceasing operations. In addition to sawmill shutdowns, outbreaks of a bark-eating species of beetle have destroyed 15 years worth of log supplies in British Columbia, Canada, limiting the supply of lumber.
Meanwhile, home buyers are taking advantage of the low costs of borrowing due to record-low mortgage rates in the U.S. This is driving up the demand for lumber from the housing market, while supply is in a bottleneck.
Corn and Soybeans
Corn and soybeans are common feed grains for livestock, including swine, beef, and poultry.
China—the largest producer and consumer of pork—has been battling outbreaks of African swine fever (ASF) since 2018, losing over 100 million pigs. As the country’s hog-herd recovers from this disease, Chinese demand for corn and soybeans is increasing and supporting higher prices. In fact, China’s corn imports from the U.S. increased 2,072% between 2019 and 2020.
Iron Ore and Tin
The global economic recovery, led by China, is fueling the demand for steel, and in turn, for iron ore. On the supply side, the industry is facing a shortage, with a decline in output from top producer Vale following a disaster at its tailings dam in Brazil.
Tin prices are soaring due to rising demand from consumer electronics amid tightening supply. According to Roskill, pandemic-induced supply disruptions led to a 10% decline in refined tin output in 2020. Additionally, shipping disruptions and low stocks at the London Metal Exchange (LME) are intensifying tin’s supply squeeze.
Copper
Copper’s story is similar to that of iron ore, wherein rebounding economies are boosting demand for the red metal. However, investors are particularly bullish on copper due to its critical role in green technologies, with looming concerns over its long-term supply.
Palladium
Many countries are imposing stricter auto emission standards—and while this may surprise you, it’s driving the demand for palladium. The precious metal is a key ingredient in catalytic converters that turn toxic emissions from gas-powered vehicles into less harmful gases.
Unlike the rollercoaster rides that are commodity prices, palladium prices have been rising for five years straight. What’s more, the palladium market has seen an annual deficit since 2012. And this trend is likely to continue with flooding at palladium mines in Russia expected to cut global supply by 5% in 2021.
The Start of a Commodity Supercycle?
While it’s difficult to predict the sustainability of these high prices, the increase in commodity prices across the board has investors gearing up for a potential commodity supercycle.
Commodity supercycles are decade-long periods during which commodity prices trend above their long-term averages. The last supercycle lasted from 1996 to around 2016, driven by rapid industrialization in Brazil, India, Russia, and China (BRIC economies). Today, governments around the world are adopting mineral-intensive clean energy technologies, which will likely increase the demand for minerals for years to come.
Are we on the brink of a new commodity supercycle?


Misc
Brass Rods: The Secure Choice
This graphic shows why brass rods are the secure choice for precision-machined and forged parts.

Brass Rods: The Secure Choice
The unique combination of machinability and recyclability makes brass rods the secure choice for manufacturers seeking future-proof raw material solutions.
This infographic, from the Copper Development Association, shows three ways brass rods give manufacturers greater control and a license to grow in the competitive market for precision-machined and forged products.
Future-Proof Investments in New Machine Tools
A material’s machinability directly impacts machine throughput, which typically has the largest impact on machine shop profitability.
The high-speed machining capabilities of brass rods maximize machine tool performance, allowing manufacturers to run the material faster and longer without sacrificing tool life, chip formation, or surface quality.
The high machining efficiency of brass leads to reduced per-part costs, quicker return on investment (ROI) for new machine tools, and expanded production capacity for new projects.
Supply Security Through Closed Loop Recycling
Brass, like its parent element copper, can be infinitely recycled.
In 2022, brass- and wire-rod mills accounted for the majority of the 830,000 tonnes of copper recycled from scrap in the U.S.
Given that scrap ratios for machined parts typically range from 60-70% by weight, producing mills benefit from a secure and steady supply of clean scrap returned directly from customers, which is recycled to create new brass rods.
The high residual value of brass scrap creates a strong recycling incentive. Scrap buy back programs give manufacturers greater control over raw material net costs as scrap value is often factored into supplier purchase agreements.
Next Generation Alloys for a Lead-Free Future
Increasingly stringent global regulations continue to pressure manufacturers to minimize the use of materials containing trace amounts of lead and other harmful impurities.
The latest generation of brass-rod alloys is engineered to meet the most demanding criteria for lead leaching in drinking water and other sensitive applications.
Seven brass-rod alloys passed rigorous testing to become the only ‘Acceptable Materials’ against lower lead leaching criteria recently adopted in the national U.S. drinking water quality standard, NSF 61.
Learn more about the advantages of brass rods solutions.
Misc
Brass Rods: The Safe Choice
From airbags to firefighting equipment, components made from brass rods play a vital role in creating a safer environment.

Brass Rods: The Safe Choice
From airbags to firefighting equipment, components made from brass rods play a vital role in creating a safer environment.
This infographic from the Copper Development Association illustrates three use cases for brass. This is the first of three infographics in our Choose Brass series.
Why Brass?
Brass is one of the most reliable metals for industrial and other applications. It contains little to no iron, protecting it from oxidation, which can cause other materials to fail over time.
Additionally, the malleability of brass ensures tight and leak-free metal-to-metal seals for threaded joints, minimizing the risk of costly and dangerous system failures. Brass’s durability ensures critical system components function properly for years.
Brass for Safe Water Systems
Exposure to lead in water can cause various health problems, including neurological damage, developmental delays, and cardiovascular diseases.
As a result, the U.S. sets minimum health-effect requirements for chemical contaminants and impurities indirectly transferred to drinking water from products, components, and materials used in water systems.
Currently, only brass rod alloys are designated as “acceptable materials” according to national standards.
Brass is also essential for ensuring workplace safety, particularly in high-risk manufacturing environments.
Using Brass for Safe Manufacturing and Industrial Environments
Brass is used extensively in industrial applications such as machinery components, valves, fittings, architectural elements, bearings, and gears.
The machinability of brass rods also means longer tool life and higher productivity for manufacturers of precision parts.
The microstructure of brass helps break up metal chips generated during machining operations, preventing long and stringy chips that can crash machines and seriously injure operators.
Additionally, brass’s non-sparking properties make it ideal for tooling, fittings, and components in high-risk industries such as oil & gas, chemicals, pharmaceuticals, paint manufacturing, power plants, and explosives.
Brass for Safer Communities
Many pieces of equipment in our daily lives also rely on brass rod parts to function. Control valves in gas stoves, BBQs, and home furnaces made from brass rods reduce the risk of deadly gas leaks and fires.
Moreover, brass is ideal for firefighting equipment due to its corrosion resistance, durability, heat resistance, and non-sparking properties.
Fittings made from brass rods ensure that the brakes and airbags in our vehicles work when needed.
Brass and other copper-based alloys are also naturally antimicrobial, helping prevent diseases when used in high-touch surfaces such as door handles.
These are only some of the ways that brass rods help build a safer world for everyone.
Explore the Advantages of Brass Rod Solutions.

-

 Electrification3 years ago
Ranked: The Top 10 EV Battery Manufacturers
-

 Electrification2 years ago
The Key Minerals in an EV Battery
-

 Real Assets3 years ago
The World’s Top 10 Gold Mining Companies
-

 Misc3 years ago
All the Metals We Mined in One Visualization
-

 Electrification3 years ago
The Biggest Mining Companies in the World in 2021
-

 Energy Shift2 years ago
What Are the Five Major Types of Renewable Energy?
-

 Electrification2 years ago
The World’s Largest Nickel Mining Companies
-

 Electrification2 years ago
Mapped: Solar Power by Country in 2021