

Energy Shift
The Future Value of Disruptive Materials
The following content is sponsored by Global X ETFs
The Briefing
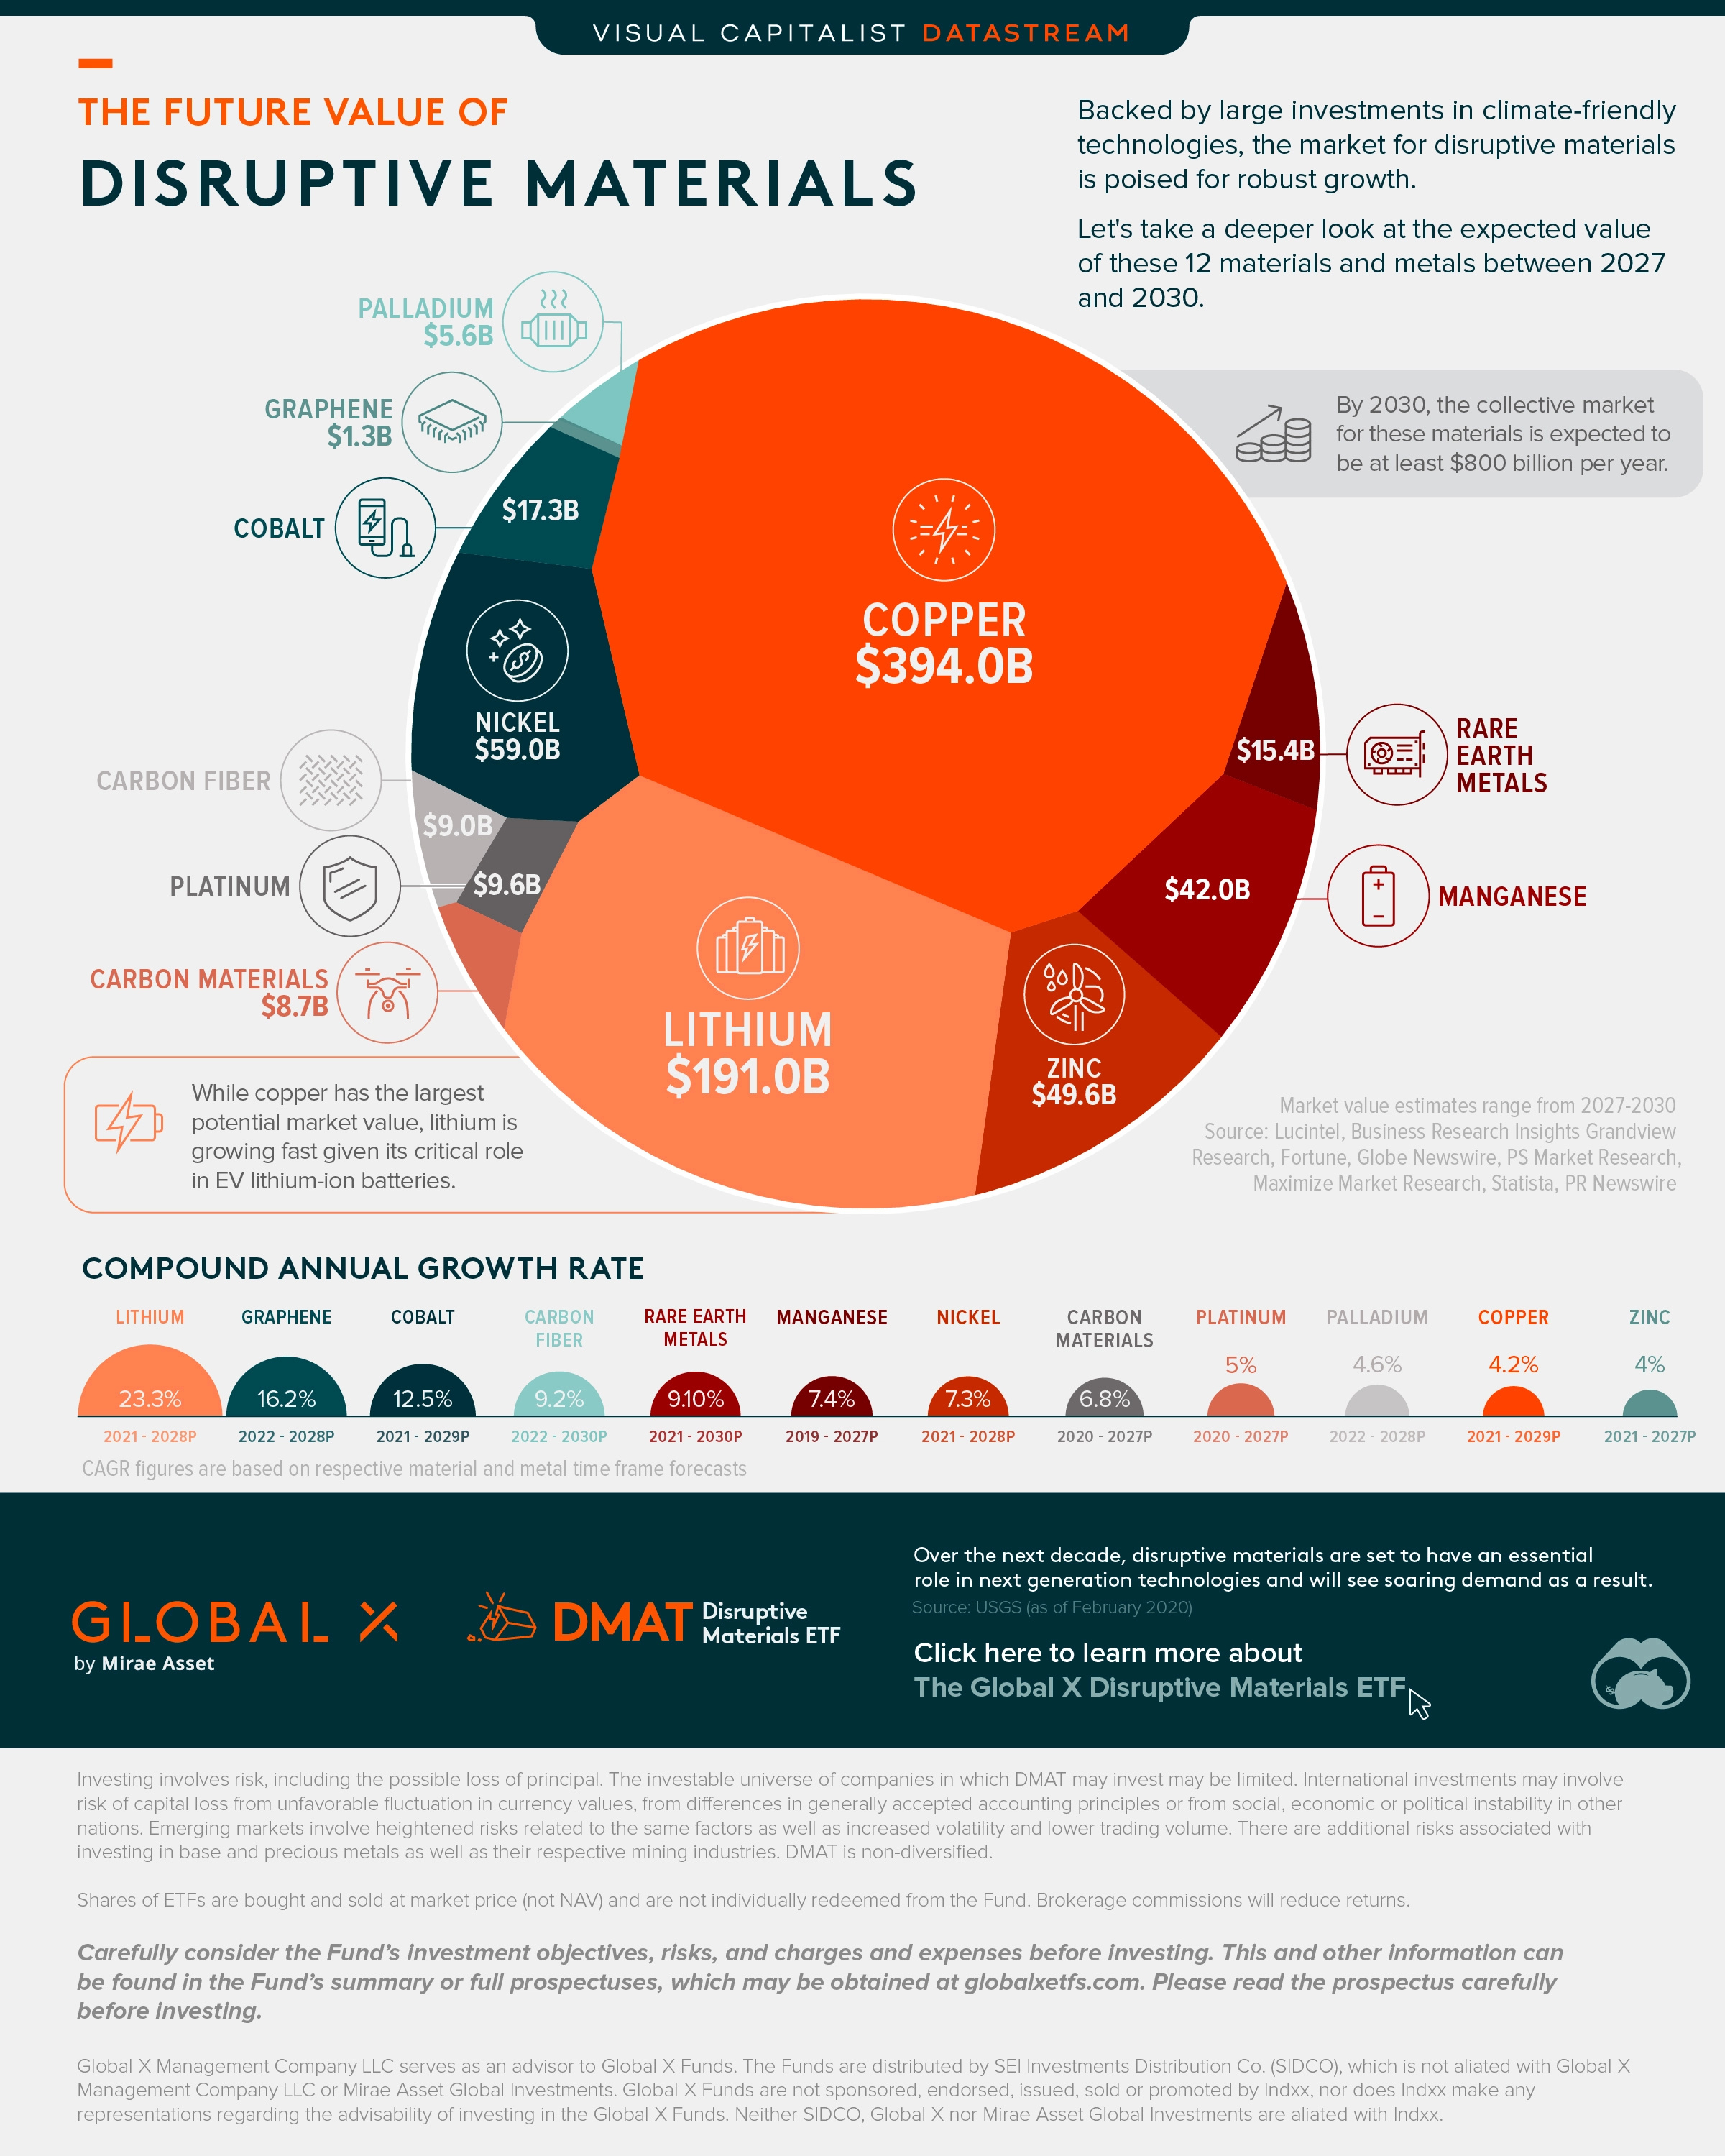
- By 2030, the collective market for disruptive materials is expected to reach over $800 billion
- Copper is the largest market while lithium is the fastest growing
The Future Value of Disruptive Materials
A select number of materials have a critical role to play in the expansion of next generation technologies. This could lead to a surge in demand and a potential soaring of market values for each material as a result.
This graphic from Global X ETFs takes a closer look at the forecasted market value for 12 disruptive materials, which are seeing increasingly large climate investment.
Soaring Market Values
The materials highlighted are each a billion dollar market in their own right. But which has the largest projected future market value?
Copper is one of the largest and most mature markets from this group. And as a result sees a lower projected compound annual growth rate (CAGR).
| Disruptive Material | Projected Market Value ($B) | CAGR (over forecast period) |
|---|---|---|
| Copper | $394.0B by 2029 | 4.2% (2021-2029P) |
| Lithium | $191.0B by 2028 | 23.3% (2021-2028P) |
| Nickel | $59.0B by 2028 | 7.3% (2021-2028P) |
| Zinc | $49.6B by 2027 | 4.0% (2021-2027P) |
| Manganese | $42.0B by 2027 | 7.4% (2019-2027P) |
| Cobalt | $17.3B by 2029 | 12.5% (2021-2029P) |
| Rare Earth Metals | $15.4B by 2030 | 9.1% (2021-2030P) |
| Platinum | $9.6B by 2027 | 5.0% (2020-2027P) |
| Carbon Fiber | $9.0B by 2030 | 9.2% (2022-2030P) |
| Carbon Materials | $8.7B by 2027 | 6.8% (2020-2027P) |
| Palladium | $5.6B by 2028 | 4.6% (2022-2028P) |
| Graphene | $1.3B by 2028 | 16.2% (2022-2028P) |
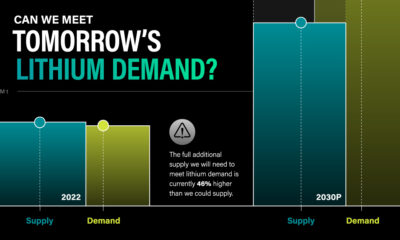
However, when it comes to the fastest growing market, lithium reigns supreme with a CAGR of over 23% between the forecast period of 2021 and 2028. Lithium is a vital ingredient for lithium-ion batteries, used in EVs and elsewhere.
Altogether, the collective market value for these top materials is expected to be worth over $800 billion by the end of the decade. And in the subsequent years, as efforts to tackle climate change accelerate, the collective value of these materials may well hit $1 trillion.
Introducing the Global X Disruptive Materials ETF
The Global X Disruptive Materials ETF (Ticker: DMAT) seeks to provide investment results that correspond generally to the price and yield performance, before fees and expenses, of the Solactive Disruptive Materials Index.
The Global X Disruptive Materials ETF is a passively managed solution that can be used to gain exposure to the rising demand for disruptive materials. Click the link to learn more.


Energy Shift
The World’s Biggest Oil Producers in 2023
Just three countries accounted for 40% of global oil production last year.

The World’s Biggest Oil Producers in 2023
This was originally posted on our Voronoi app. Download the app for free on iOS or Android and discover incredible data-driven charts from a variety of trusted sources.
Despite efforts to decarbonize the global economy, oil still remains one of the world’s most important resources. It’s also produced by a fairly limited group of countries, which can be a source of economic and political leverage.
This graphic illustrates global crude oil production in 2023, measured in million barrels per day, sourced from the U.S. Energy Information Administration (EIA).
Three Countries Account for 40% of Global Oil Production
In 2023, the United States, Russia, and Saudi Arabia collectively contributed 32.7 million barrels per day to global oil production.
| Oil Production 2023 | Million barrels per day |
|---|---|
| 🇺🇸 U.S. | 12.9 |
| 🇷🇺 Russia | 10.1 |
| 🇸🇦 Saudi Arabia | 9.7 |
| 🇨🇦 Canada | 4.6 |
| 🇮🇶 Iraq | 4.3 |
| 🇨🇳 China | 4.2 |
| 🇮🇷 Iran | 3.6 |
| 🇧🇷 Brazil | 3.4 |
| 🇦🇪 UAE | 3.4 |
| 🇰🇼 Kuwait | 2.7 |
| 🌍 Other | 22.8 |
These three nations have consistently dominated oil production since 1971. The leading position, however, has alternated among them over the past five decades.
In contrast, the combined production of the next three largest producers—Canada, Iraq, and China—reached 13.1 million barrels per day in 2023, just surpassing the production of the United States alone.
In the near term, no country is likely to surpass the record production achieved by the U.S. in 2023, as no other producer has ever reached a daily capacity of 13.0 million barrels. Recently, Saudi Arabia’s state-owned Saudi Aramco scrapped plans to increase production capacity to 13.0 million barrels per day by 2027.
In 2024, analysts forecast that the U.S. will maintain its position as the top oil producer. In fact, according to Macquarie Group, U.S. oil production is expected to achieve a record pace of about 14 million barrels per day by the end of the year.
Energy Shift
How Much Does the U.S. Depend on Russian Uranium?
Despite a new uranium ban being discussed in Congress, the U.S. is still heavily dependent on Russian uranium.

How Much Does the U.S. Depend on Russian Uranium?
This was originally posted on our Voronoi app. Download the app for free on iOS or Android and discover incredible data-driven charts from a variety of trusted sources.
The U.S. House of Representatives recently passed a ban on imports of Russian uranium. The bill must pass the Senate before becoming law.
In this graphic, we visualize how much the U.S. relies on Russian uranium, based on data from the United States Energy Information Administration (EIA).
U.S. Suppliers of Enriched Uranium
After Russia invaded Ukraine, the U.S. imposed sanctions on Russian-produced oil and gas—yet Russian-enriched uranium is still being imported.
Currently, Russia is the largest foreign supplier of nuclear power fuel to the United States. In 2022, Russia supplied almost a quarter of the enriched uranium used to fuel America’s fleet of more than 90 commercial reactors.
| Country of enrichment service | SWU* | % |
|---|---|---|
| 🇺🇸 United States | 3,876 | 27.34% |
| 🇷🇺 Russia | 3,409 | 24.04% |
| 🇩🇪 Germany | 1,763 | 12.40% |
| 🇬🇧 United Kingdom | 1,593 | 11.23% |
| 🇳🇱 Netherlands | 1,303 | 9.20% |
| Other | 2,232 | 15.79% |
| Total | 14,176 | 100% |
SWU stands for “Separative Work Unit” in the uranium industry. It is a measure of the amount of work required to separate isotopes of uranium during the enrichment process. Source: U.S. Energy Information Administration
Most of the remaining uranium is imported from European countries, while another portion is produced by a British-Dutch-German consortium operating in the United States called Urenco.
Similarly, nearly a dozen countries around the world depend on Russia for more than half of their enriched uranium—and many of them are NATO-allied members and allies of Ukraine.
In 2023 alone, the U.S. nuclear industry paid over $800 million to Russia’s state-owned nuclear energy corporation, Rosatom, and its fuel subsidiaries.
It is important to note that 19% of electricity in the U.S. is powered by nuclear plants.
The dependency on Russian fuels dates back to the 1990s when the United States turned away from its own enrichment capabilities in favor of using down-blended stocks of Soviet-era weapons-grade uranium.
As part of the new uranium-ban bill, the Biden administration plans to allocate $2.2 billion for the expansion of uranium enrichment facilities in the United States.

-

 Electrification3 years ago
Ranked: The Top 10 EV Battery Manufacturers
-

 Electrification2 years ago
The Key Minerals in an EV Battery
-

 Real Assets3 years ago
The World’s Top 10 Gold Mining Companies
-

 Misc3 years ago
All the Metals We Mined in One Visualization
-

 Electrification3 years ago
The Biggest Mining Companies in the World in 2021
-

 Energy Shift2 years ago
What Are the Five Major Types of Renewable Energy?
-

 Electrification2 years ago
The World’s Largest Nickel Mining Companies
-

 Electrification2 years ago
Mapped: Solar Power by Country in 2021