

Real Assets
All the Metals We Mined in 2021 in One Visualization
View the full-size infographic
All the Metals We Mined in 2021
“If you can’t grow it, you have to mine it” is a famous saying that encapsulates the importance of minerals and metals in the modern world.
From every building we enter to every device we use, virtually everything around us contains some amount of metal.
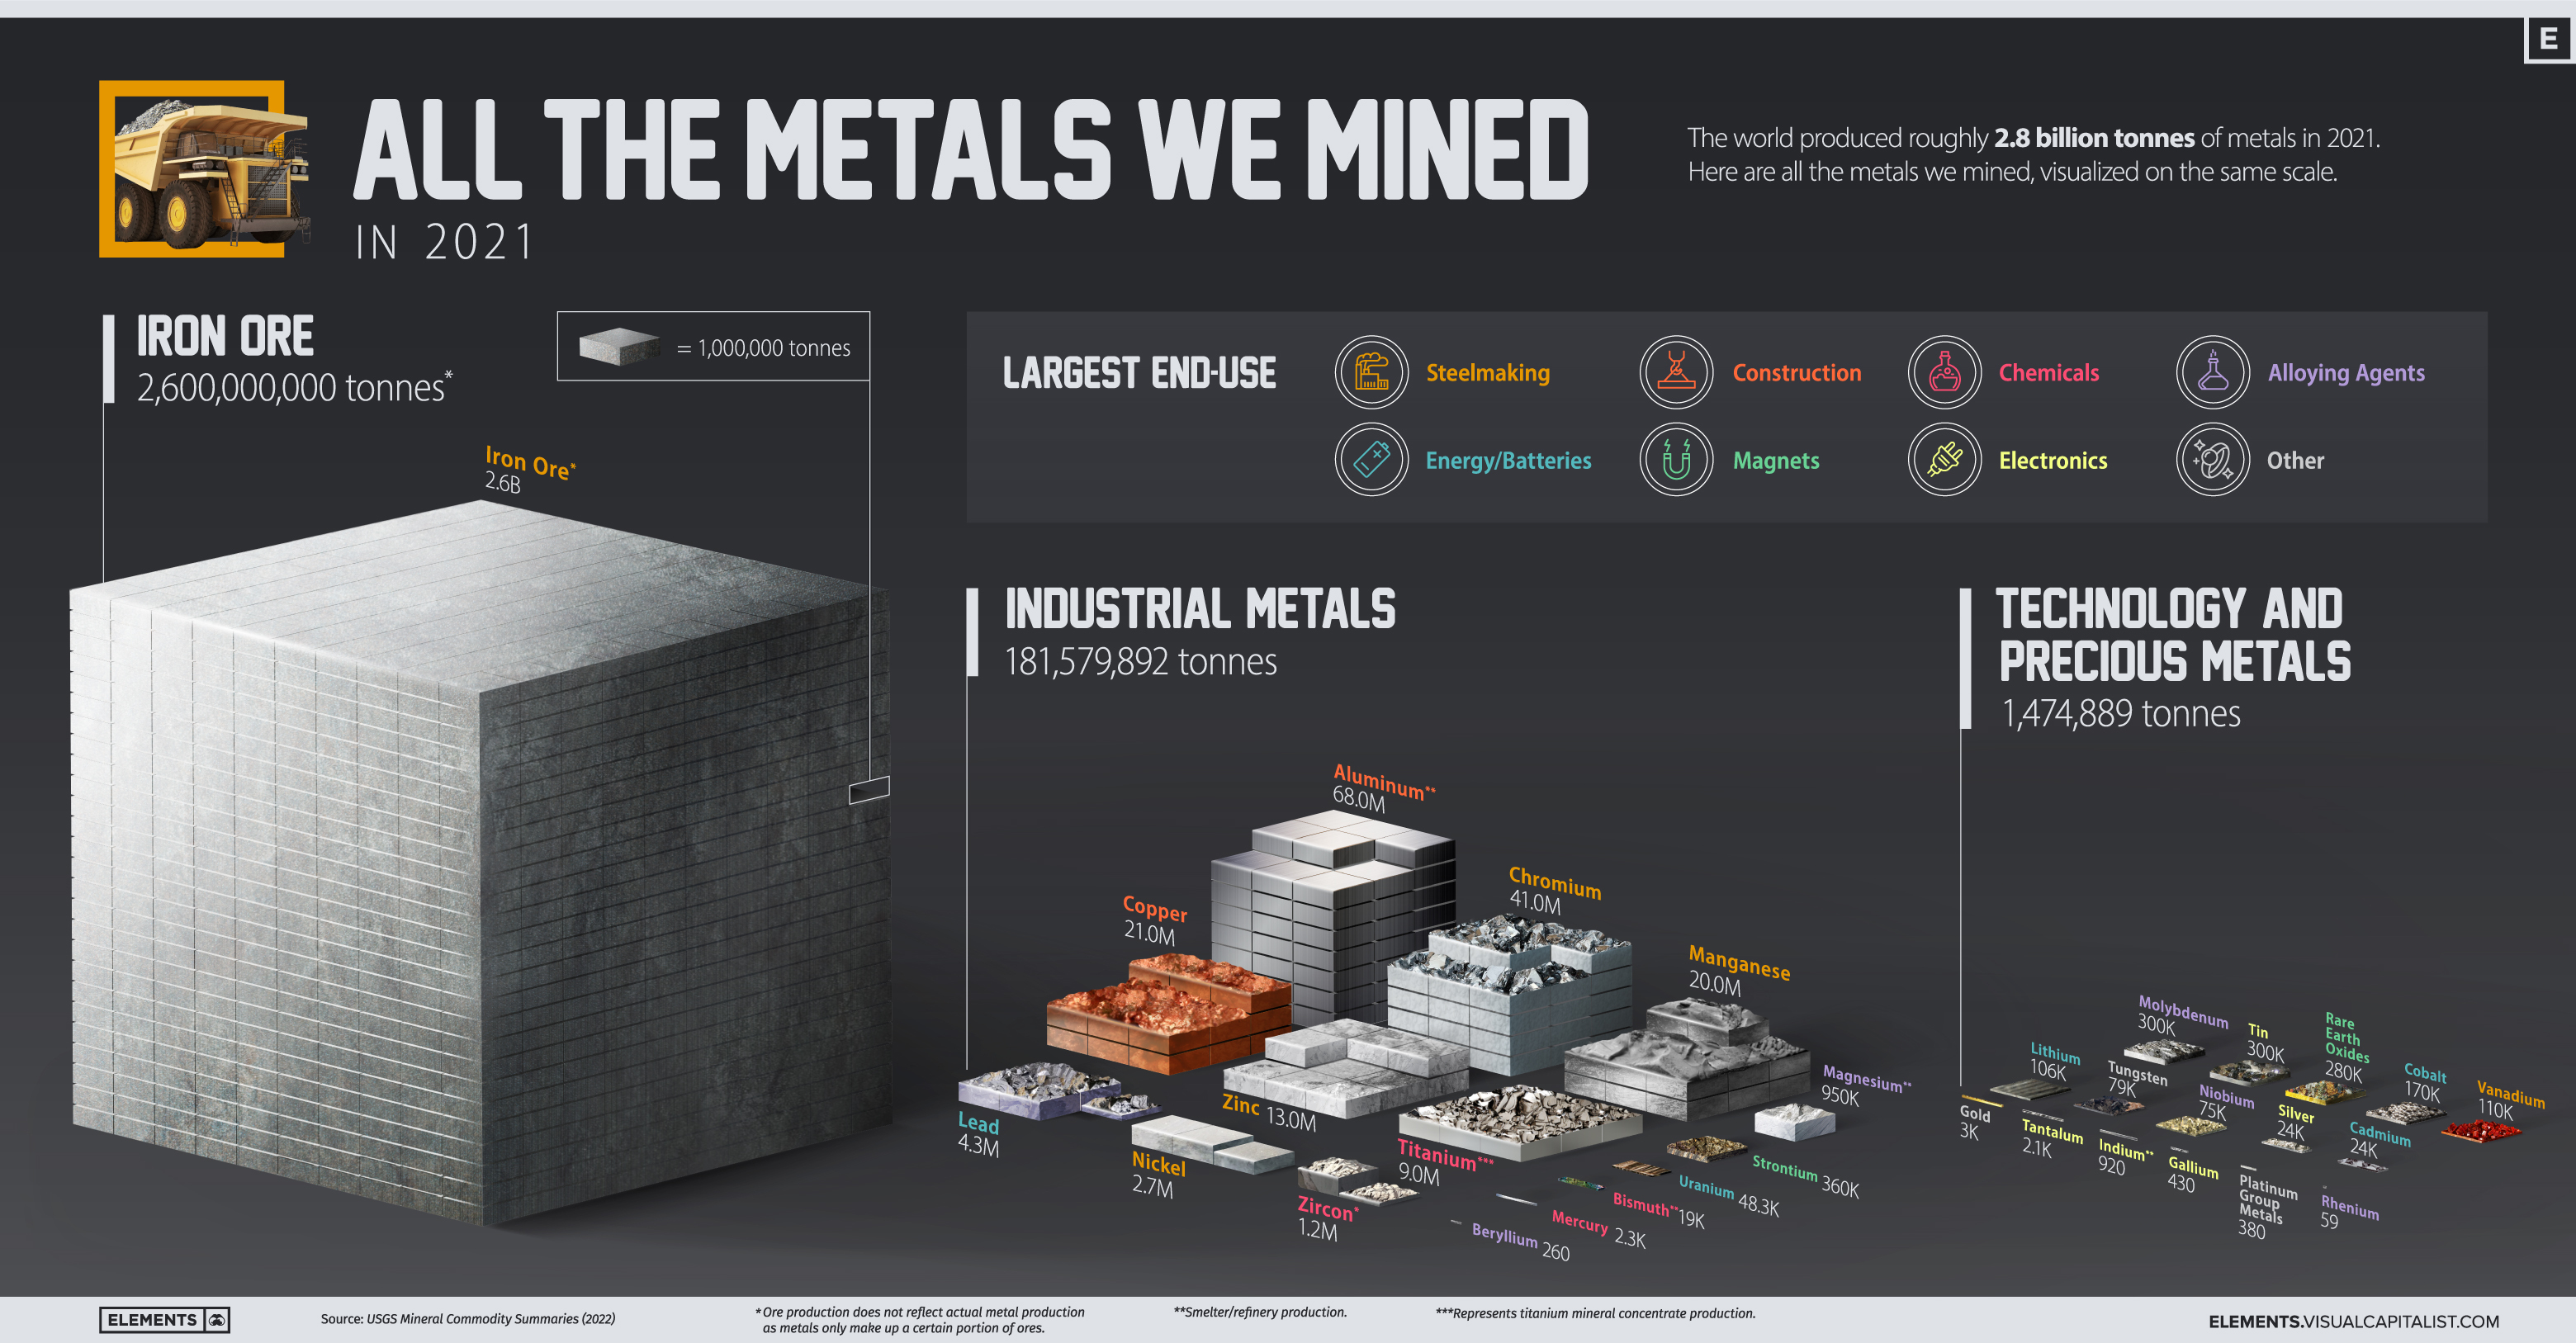
The above infographic visualizes all 2.8 billion tonnes of metals mined in 2021 and highlights each metal’s largest end-use using data from the United States Geological Survey (USGS).
Why Do We Mine So Much Iron Ore?
Iron ore accounted for 93% of the metals mined in 2021, with 2.6 billion tonnes extracted from the ground. It’s important to note that this is ore production, which is typically higher than metal production since metals are extracted and refined from ores.
| Metal/Ore | 2021 Mine Production (tonnes) | % of Total |
|---|---|---|
| Iron ore | 2,600,000,000 | 93.4% |
| Industrial metals | 181,579,892 | 6.5% |
| Technology and precious metals | 1,474,889 | 0.05% |
| Total | 2,783,054,781 | 100% |
With 98% of it converted into pig iron to make steel, iron ore is ubiquitous in our lives. Steel made from iron ore is used in construction, transportation, and household appliances, and it’s likely that you encounter something made out of it every day, especially if you live in a city.
Due to its key role in building infrastructure, iron ore is one of the most important materials supporting urbanization and economic growth.
Industrial Metals
Industrial metals are largely used in steelmaking, construction, chemical manufacturing, and as alloying agents. In 2021, the world mined over 181 million tonnes of these metals.
| Industrial Metals | 2021 Mine Production (tonnes) | % of Total |
|---|---|---|
| Aluminum* | 68,000,000 | 37.4% |
| Chromium | 41,000,000 | 22.6% |
| Copper | 21,000,000 | 11.6% |
| Manganese | 20,000,000 | 11.0% |
| Zinc | 13,000,000 | 7.2% |
| Titanium (mineral concentrates) | 9,000,000 | 5.0% |
| Lead | 4,300,000 | 2.4% |
| Nickel | 2,700,000 | 1.5% |
| Zirconium Minerals (Zircon) | 1,200,000 | 0.7% |
| Magnesium* | 950,000 | 0.5% |
| Strontium | 360,000 | 0.2% |
| Uranium | 48,332 | 0.03% |
| Bismuth* | 19,000 | 0.01% |
| Mercury | 2,300 | 0.001% |
| Beryllium | 260 | 0.0001% |
| Total | 181,579,892 | 100.0% |
*Represents refinery/smelter production.
Aluminum accounted for nearly 40% of industrial metal production in 2021. China was by far the largest aluminum producer, making up more than half of global production. The construction industry uses roughly 25% of annually produced aluminum, with 23% going into transportation.
Chromium is a lesser-known metal with a key role in making stainless steel stainless. In fact, stainless steel is usually composed of 10% to 30% of chromium, enhancing its strength and corrosion resistance.
Copper, manganese, and zinc round out the top five industrial metals mined in 2021, each with its own unique properties and roles in the economy.
Technology and Precious Metals
Technology metals include those that are commonly used in technology and devices. Compared to industrial metals, these are usually mined on a smaller scale and could see faster consumption growth as the world adopts new technologies.
| Technology and Precious Metals | 2021 Mine Production (tonnes) | % of Total |
|---|---|---|
| Tin | 300,000 | 20.3% |
| Molybdenum | 300,000 | 20.3% |
| Rare Earth Oxides | 280,000 | 19.0% |
| Cobalt | 170,000 | 11.5% |
| Vanadium | 110,000 | 7.5% |
| Lithium | 106,000 | 7.2% |
| Tungsten | 79,000 | 5.4% |
| Niobium | 75,000 | 5.1% |
| Silver | 24,000 | 1.6% |
| Cadmium | 24,000 | 1.6% |
| Gold | 3,000 | 0.2% |
| Tantalum | 2,100 | 0.1% |
| Indium* | 920 | 0.1% |
| Gallium | 430 | 0.03% |
| Platinum Group Metals | 380 | 0.03% |
| Rhenium | 59 | 0.004% |
| Total | 1,474,889 | 100% |
*Represents refinery/smelter production.
The major use of rhenium, one of the rarest metals, is in superalloys that are critical for engine turbine blades in aircraft and gas turbine engines. The petroleum industry uses it in rhenium-platinum catalysts to produce high-octane gasoline for vehicles.
In terms of growth, clean energy technology metals stand out. For example, lithium production has more than doubled since 2016 and is set to ride the boom in EV battery manufacturing. Over the same period, global rare earth production more than doubled, driven by the rising demand for magnets.
Indium is another interesting metal on this list. Most of it is used to make indium tin oxide, an important component of touchscreens, TV screens, and solar panels.
The Metal Mining Megatrend
The world’s material consumption has grown significantly over the last few decades, with growing economies and cities demanding more resources.
Global production of both iron ore and aluminum has more than tripled relative to the mid-1990s. Other metals, including copper and steel, have also seen significant consumption growth.
Today, economies are not only growing and urbanizing but also adopting mineral-intensive clean energy technologies, pointing towards further increases in metal production and consumption.


Real Assets
Charted: The Value Gap Between the Gold Price and Gold Miners
While gold prices hit all-time highs, gold mining stocks have lagged far behind.

Gold Price vs. Gold Mining Stocks
This was originally posted on our Voronoi app. Download the app for free on Apple or Android and discover incredible data-driven charts from a variety of trusted sources.
Although the price of gold has reached new record highs in 2024, gold miners are still far from their 2011 peaks.
In this graphic, we illustrate the evolution of gold prices since 2000 compared to the NYSE Arca Gold BUGS Index (HUI), which consists of the largest and most widely held public gold production companies. The data was compiled by Incrementum AG.
Mining Stocks Lag Far Behind
In April 2024, gold reached a new record high as Federal Reserve Chair Jerome Powell signaled policymakers may delay interest rate cuts until clearer signs of declining inflation materialize.
Additionally, with elections occurring in more than 60 countries in 2024 and ongoing conflicts in Ukraine and Gaza, central banks are continuing to buy gold to strengthen their reserves, creating momentum for the metal.
Traditionally known as a hedge against inflation and a safe haven during times of political and economic uncertainty, gold has climbed over 11% so far this year.
According to Business Insider, gold miners experienced their best performance in a year in March 2024. During that month, the gold mining sector outperformed all other U.S. industries, surpassing even the performance of semiconductor stocks.
Still, physical gold has outperformed shares of gold-mining companies over the past three years by one of the largest margins in decades.
| Year | Gold Price | NYSE Arca Gold BUGS Index (HUI) |
|---|---|---|
| 2023 | $2,062.92 | $243.31 |
| 2022 | $1,824.32 | $229.75 |
| 2021 | $1,828.60 | $258.87 |
| 2020 | $1,895.10 | $299.64 |
| 2019 | $1,523.00 | $241.94 |
| 2018 | $1,281.65 | $160.58 |
| 2017 | $1,296.50 | $192.31 |
| 2016 | $1,151.70 | $182.31 |
| 2015 | $1,060.20 | $111.18 |
| 2014 | $1,199.25 | $164.03 |
| 2013 | $1,201.50 | $197.70 |
| 2012 | $1,664.00 | $444.22 |
| 2011 | $1,574.50 | $498.73 |
| 2010 | $1,410.25 | $573.32 |
| 2009 | $1,104.00 | $429.91 |
| 2008 | $865.00 | $302.41 |
| 2007 | $836.50 | $409.37 |
| 2006 | $635.70 | $338.24 |
| 2005 | $513.00 | $276.90 |
| 2004 | $438.00 | $215.33 |
| 2003 | $417.25 | $242.93 |
| 2002 | $342.75 | $145.12 |
| 2001 | $276.50 | $65.20 |
| 2000 | $272.65 | $40.97 |
Among the largest companies on the NYSE Arca Gold BUGS Index, Colorado-based Newmont has experienced a 24% drop in its share price over the past year. Similarly, Canadian Barrick Gold also saw a decline of 6.5% over the past 12 months.
Real Assets
200 Years of Global Gold Production, by Country
Global gold production has grown exponentially since the 1800s, with 86% of all above-ground gold mined in the last 200 years.


Visualizing Global Gold Production Over 200 Years
Although the practice of gold mining has been around for thousands of years, it’s estimated that roughly 86% of all above-ground gold was extracted in the last 200 years.
With modern mining techniques making large-scale production possible, global gold production has grown exponentially since the 1800s.
The above infographic uses data from Our World in Data to visualize global gold production by country from 1820 to 2022, showing how gold mining has evolved to become increasingly global over time.
A Brief History of Gold Mining
The best-known gold rush in modern history occurred in California in 1848, when James Marshall discovered gold in Sacramento Valley. As word spread, thousands of migrants flocked to California in search of gold, and by 1855, miners had extracted around $2 billion worth of gold.
The United States, Australia, and Russia were (interchangeably) the three largest gold producers until the 1890s. Then, South Africa took the helm thanks to the massive discovery in the Witwatersrand Basin, now regarded today as one of the world’s greatest ever goldfields.
South Africa’s annual gold production peaked in 1970 at 1,002 tonnes—by far the largest amount of gold produced by any country in a year.
With the price of gold rising since the 1980s, global gold production has become increasingly widespread. By 2007, China was the world’s largest gold-producing nation, and today a significant quantity of gold is being mined in over 40 countries.
The Top Gold-Producing Countries in 2022
Around 31% of the world’s gold production in 2022 came from three countries—China, Russia, and Australia, with each producing over 300 tonnes of the precious metal.
| Rank | Country | 2022E Gold Production, tonnes | % of Total |
|---|---|---|---|
| #1 | 🇨🇳 China | 330 | 11% |
| #2 | 🇷🇺 Russia | 320 | 10% |
| #3 | 🇦🇺 Australia | 320 | 10% |
| #4 | 🇨🇦 Canada | 220 | 7% |
| #5 | 🇺🇸 United States | 170 | 5% |
| #6 | 🇲🇽 Mexico | 120 | 4% |
| #7 | 🇰🇿 Kazakhstan | 120 | 4% |
| #8 | 🇿🇦 South Africa | 110 | 4% |
| #9 | 🇵🇪 Peru | 100 | 3% |
| #10 | 🇺🇿 Uzbekistan | 100 | 3% |
| #11 | 🇬🇭 Ghana | 90 | 3% |
| #12 | 🇮🇩 Indonesia | 70 | 2% |
| - | 🌍 Rest of the World | 1,030 | 33% |
| - | World Total | 3,100 | 100% |
North American countries Canada, the U.S., and Mexico round out the top six gold producers, collectively making up 16% of the global total. The state of Nevada alone accounted for 72% of U.S. production, hosting the world’s largest gold mining complex (including six mines) owned by Nevada Gold Mines.
Meanwhile, South Africa produced 110 tonnes of gold in 2022, down by 74% relative to its output of 430 tonnes in 2000. This long-term decline is the result of mine closures, maturing assets, and industrial conflict, according to the World Gold Council.
Interestingly, two smaller gold producers on the list, Uzbekistan and Indonesia, host the second and third-largest gold mining operations in the world, respectively.
The Outlook for Global Gold Production
As of April 25, gold prices were hovering around the $2,000 per ounce mark and nearing all-time highs. For mining companies, higher gold prices can mean more profits per ounce if costs remain unaffected.
According to the World Gold Council, mined gold production is expected to increase in 2023 and could surpass the record set in 2018 (3,300 tonnes), led by the expansion of existing projects in North America. The chances of record mine output could be higher if gold prices continue to increase.

-

 Electrification3 years ago
Ranked: The Top 10 EV Battery Manufacturers
-

 Electrification2 years ago
The Key Minerals in an EV Battery
-

 Real Assets3 years ago
The World’s Top 10 Gold Mining Companies
-

 Misc3 years ago
All the Metals We Mined in One Visualization
-

 Electrification3 years ago
The Biggest Mining Companies in the World in 2021
-

 Energy Shift2 years ago
What Are the Five Major Types of Renewable Energy?
-

 Electrification2 years ago
Mapped: Solar Power by Country in 2021
-

 Electrification2 years ago
The World’s Largest Nickel Mining Companies