

Electrification
The World’s Top 10 Lithium Mining Companies
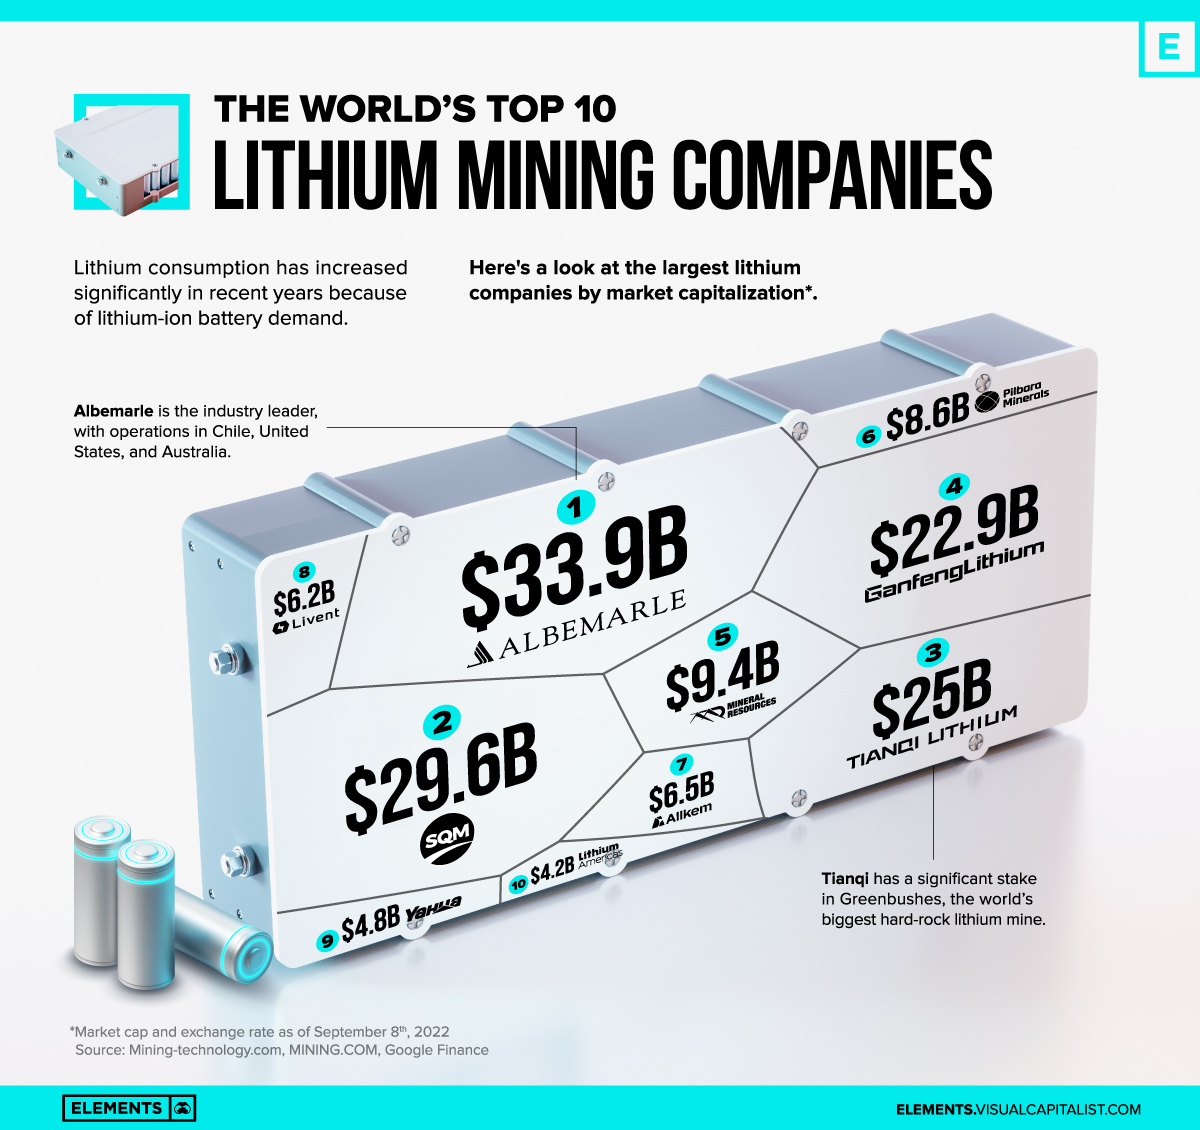
The World’s Top 10 Lithium Mining Companies
Battery demand for electric vehicles, energy storage systems, and portable electronic devices is propelling lithium mining around the planet.
As a result, worldwide lithium production increased by 21% in 2021 compared to 2020 to approximately 100,000 metric tons.
The above infographic lists the world’s largest mining companies of the white metal by market capitalization.
Where Does Lithium Come From?
There are two primary sources to obtain lithium:
- Brine: Lithium brine deposits are accumulations of saline groundwater enriched in dissolved lithium. Although abundant in nature, only select regions in the world contain brines, mostly in South America.
- Mineral/Hard Rock: Lithium found in ‘hard rock’ is a part of minerals hosted in pegmatites, rock units formed when mineral-rich magma intrudes from magma chambers into the Earth’s crust. As the magma cools, water and other minerals become concentrated.
Lithium can also be extracted from lithium clays, but there’s still no commercial scale of production for this method of extraction.
Here’s a look at lithium resources and production by country:
| Country | Mine Production (metric tons) | Reserves (metric tons) |
|---|---|---|
| 🇦🇺 Australia | 55,000 | 5,700,000 |
| 🇨🇱 Chile | 26,000 | 9,200,000 |
| 🇨🇳 China | 14,000 | 1,500,000 |
| 🇦🇷 Argentina | 6,200 | 2,200,000 |
| 🇧🇷 Brazil | 1,500 | 95,000 |
| 🇿🇼 Zimbabwe | 1,200 | 220,000 |
| 🇵🇹 Portugal | 900 | 60,000 |
| 🇺🇸 United States | Withheld | 750,000 |
| 🌐 Other countries | — | 2,700,000 |
According to the U.S. Geological Survey, four mineral operations in Australia, two brine operations each in Argentina and Chile, and two brine and one mineral operation in China accounted for the majority of global lithium production in 2021.
The Largest Lithium Miners
The world’s largest lithium producer, Albemarle Corporation, operates at the Chilean resource of Salar de Atacama in partnership with the second biggest producer, Sociedad Química y Minera de Chile (SQM). Salar de Atacama is home to almost a quarter of the world’s current supply of lithium and has been in operation since the 1980s.
Albemarle also has assets in Nevada, U.S., and Australia. Its Clayton Valley operation is the only source of lithium production in the United States.
| Rank | Company | Market Cap (in billions $) |
|---|---|---|
| #1 | Albemarle | 33.9 |
| #2 | SQM (Sociedad Química y Minera de Chile) | 29.6 |
| #3 | Tianqi Lithium | 25.0 |
| #4 | Ganfeng Lithium | 22.9 |
| #5 | Mineral Resources Ltd. | 9.4 |
| #6 | Pilbara Minerals | 8.6 |
| #7 | Allkem | 6.5 |
| #8 | Livent | 6.2 |
| #9 | Sichuan Yahua Industrial | 4.8 |
| #10 | Lithium Americas | 4.2 |
While Australia and Chile account for the majority of lithium supply, China has more than half of all capacity for refining it into specialized battery chemicals.
As part of the country’s efforts to dominate the clean energy metals supply chain, three Chinese companies are also among the top lithium mining companies. The biggest, Tianqi Lithium, has a significant stake in Greenbushes, the world’s biggest hard-rock lithium mine in Australia.
Lithium Supply Security
Between 2000 and 2010, lithium consumption in batteries increased by 20% annually. In the following decade, that figure jumped to 107% per year for batteries, with overall lithium consumption growing 27% annually on average.
Demand for lithium is forecast to almost triple by mid-decade from last year’s level, according to BloombergNEF.
Therefore, lithium supply security has become a top priority for tech companies in Asia, Europe, and the United States.


Electrification
Ranked: The Top 10 EV Battery Manufacturers in 2023
Asia dominates this ranking of the world’s largest EV battery manufacturers in 2023.

The Top 10 EV Battery Manufacturers in 2023
This was originally posted on our Voronoi app. Download the app for free on iOS or Android and discover incredible data-driven charts from a variety of trusted sources.
Despite efforts from the U.S. and EU to secure local domestic supply, all major EV battery manufacturers remain based in Asia.
In this graphic we rank the top 10 EV battery manufacturers by total battery deployment (measured in megawatt-hours) in 2023. The data is from EV Volumes.
Chinese Dominance
Contemporary Amperex Technology Co. Limited (CATL) has swiftly risen in less than a decade to claim the title of the largest global battery group.
The Chinese company now has a 34% share of the market and supplies batteries to a range of made-in-China vehicles, including the Tesla Model Y, SAIC’s MG4/Mulan, and Li Auto models.
| Company | Country | 2023 Production (megawatt-hour) | Share of Total Production |
|---|---|---|---|
| CATL | 🇨🇳China | 242,700 | 34% |
| BYD | 🇨🇳China | 115,917 | 16% |
| LG Energy Solution | 🇰🇷Korea | 108,487 | 15% |
| Panasonic | 🇯🇵Japan | 56,560 | 8% |
| SK On | 🇰🇷Korea | 40,711 | 6% |
| Samsung SDI | 🇰🇷Korea | 35,703 | 5% |
| CALB | 🇨🇳China | 23,493 | 3% |
| Farasis Energy | 🇨🇳China | 16,527 | 2% |
| Envision AESC | 🇨🇳China | 8,342 | 1% |
| Sunwoda | 🇨🇳China | 6,979 | 1% |
| Other | - | 56,040 | 8% |
In 2023, BYD surpassed LG Energy Solution to claim second place. This was driven by demand from its own models and growth in third-party deals, including providing batteries for the made-in-Germany Tesla Model Y, Toyota bZ3, Changan UNI-V, Venucia V-Online, as well as several Haval and FAW models.
The top three battery makers (CATL, BYD, LG) collectively account for two-thirds (66%) of total battery deployment.
Once a leader in the EV battery business, Panasonic now holds the fourth position with an 8% market share, down from 9% last year. With its main client, Tesla, now effectively sourcing batteries from multiple suppliers, the Japanese battery maker seems to be losing its competitive edge in the industry.
Overall, the global EV battery market size is projected to grow from $49 billion in 2022 to $98 billion by 2029, according to Fortune Business Insights.
Electrification
White Gold: Mapping U.S. Lithium Mines
In this graphic, Visual Capitalist partnerered with EnergyX to explore the size and location of U.S. lithium mines.

White Gold: Mapping U.S. Lithium Mines
The U.S. doubled imports of lithium-ion batteries for the third consecutive year in 2022, and with EV demand growing yearly, U.S. lithium mines must ramp up production or rely on other nations for their supply of refined lithium.
To determine if the domestic U.S. lithium opportunity can meet demand, we partnered with EnergyX to determine how much lithium sits within U.S. borders.
U.S. Lithium Projects
The most crucial measure of a lithium mine’s potential is the quantity that can be extracted from the source.
For each lithium resource, the potential volume of lithium carbonate equivalent (LCE) was calculated with a ratio of one metric ton of lithium producing 5.32 metric tons of LCE. Cumulatively, existing U.S. lithium projects contain 94.8 million metric tons of LCE.
| Rank | Project Name | LCE, million metric tons (est.) |
|---|---|---|
| 1 | McDermitt Caldera | 21.5 |
| 2 | Thacker Pass | 19.1 |
| 3 | Tonopah Flats | 18.0 |
| 4 | TLC Lithium | 10.7 |
| 5 | Clayton Valley (Century Lithium) | 6.3 |
| 6 | Zeus Lithium | 6.3 |
| 7 | Rhyolite Ridge | 3.4 |
| 8 | Arkansas Smackover (Phase 1A) | 2.8 |
| 9 | Basin Project | 2.2 |
| 10 | McGee Deposit | 2.1 |
| 11 | Arkansas Smackover (South West) | 1.8 |
| 12 | Clayton Valley (Lithium-X, Pure Energy) | 0.8 |
| 13 | Big Sandy | 0.3 |
| 14 | Imperial Valley/Salton Sea | 0.3 |
U.S. Lithium Opportunities, By State
U.S. lithium projects mainly exist in western states, with comparatively minor opportunities in central or eastern states.
| State | LCE, million metric tons (est.) |
|---|---|
| Nevada | 88.2 |
| Arkansas | 4.6 |
| Arizona | 2.5 |
| California | 0.3 |
Currently, the U.S. is sitting on a wealth of lithium that it is underutilizing. For context, in 2022, the U.S. only produced about 5,000 metric tons of LCE and imported a projected 19,000 metric tons of LCE, showing that the demand for the mineral is healthy.
The Next Gold Rush?
U.S. lithium companies have the opportunity to become global leaders in lithium production and accelerate the transition to sustainable energy sources. This is particularly important as the demand for lithium is increasing every year.
EnergyX is on a mission to meet U.S. lithium demands using groundbreaking technology that can extract 300% more lithium from a source than traditional methods.
You can take advantage of this opportunity by investing in EnergyX and joining other significant players like GM in becoming a shareholder.


-

 Electrification3 years ago
Ranked: The Top 10 EV Battery Manufacturers
-

 Electrification2 years ago
The Key Minerals in an EV Battery
-

 Real Assets3 years ago
The World’s Top 10 Gold Mining Companies
-

 Misc3 years ago
All the Metals We Mined in One Visualization
-

 Electrification3 years ago
The Biggest Mining Companies in the World in 2021
-

 Energy Shift2 years ago
What Are the Five Major Types of Renewable Energy?
-

 Electrification2 years ago
Mapped: Solar Power by Country in 2021
-

 Electrification2 years ago
The World’s Largest Nickel Mining Companies