

Energy Shift
The Carbon Emissions of Producing Energy Transition Metals: Charted
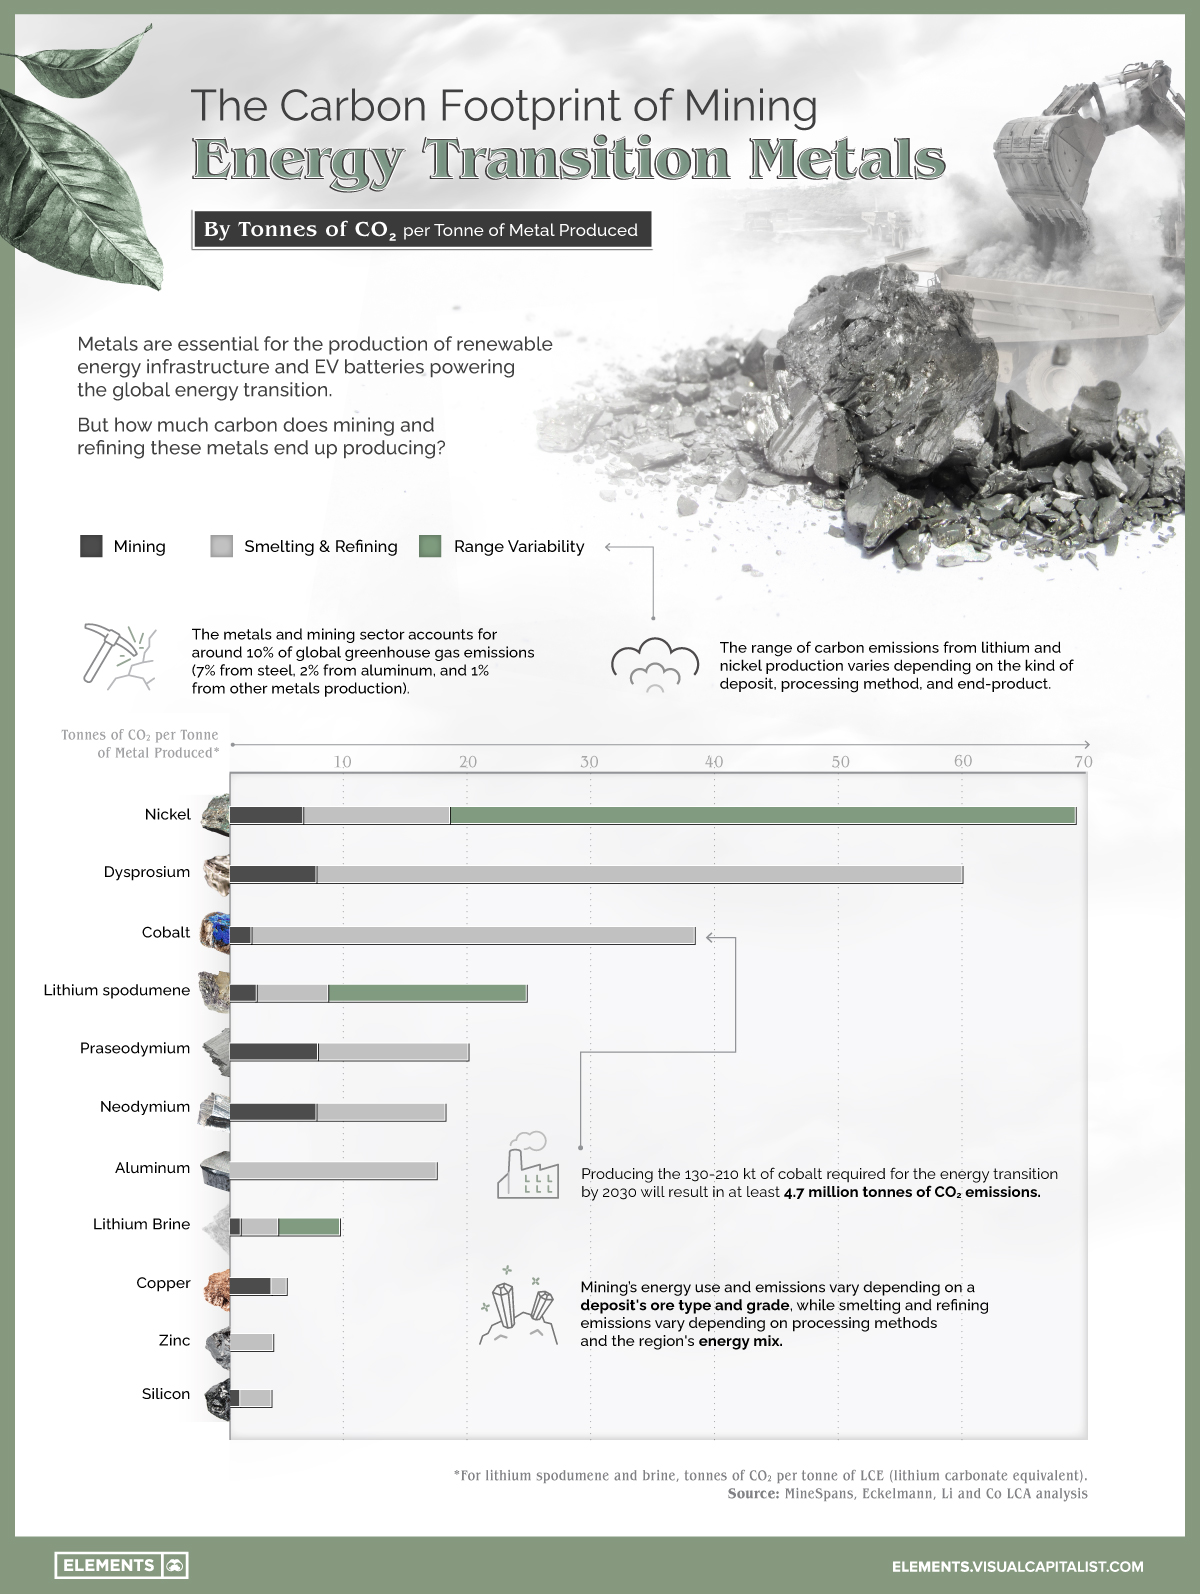


Visualizing the Carbon Footprint of Metals Mining
Metals are the backbone of clean energy infrastructure and technologies, but the mining and processing of energy transition metals also generates significant carbon emissions.
From the lithium and cobalt needed for electric vehicle batteries to the rare earth metals which power wind turbines, procuring all of these metals comes at a cost to the environment.
This graphic uses data from a KU Leuven report to visualize the carbon emissions from the mining and processing of various energy transition metals.
The Carbon Cost of Mining Clean Energy Metals
Metals mining and processing are highly energy-intensive operations, with the sector accounting for approximately 10% of global greenhouse gas emissions. While steel production makes up a large part of mining and metal emissions on the global scale (7%), other metals also generate millions of tonnes of carbon dioxide equivalent each year.
Nickel, dysprosium, and cobalt are the three metals which generate the most CO2, with nickel having a high variability depending on the deposit type and end product.
Dysprosium is an essential rare earth metal that is used in neodymium-based magnets found in wind turbines and electric vehicles. Nickel is primarily used in the production of stainless steel, but it is also essential alongside cobalt for the production of nickel-cobalt-aluminum and nickel-manganese=cobalt cathodes for EV batteries.
As a result, the demand for these metals is expected to increase significantly over the next three decades:
| Metal | Energy Transition Demand by 2030 | Energy Transition Demand by 2050 |
|---|---|---|
| Aluminum | 15-22 Mt | 25-42 Mt |
| Copper | 5.5-8 Mt | 9-15 Mt |
| Zinc | 0.7-1.5 Mt | 1.5-2.7 Mt |
| Lithium | 1,900-3,000 kt | 3,700-8,000 kt |
| Nickel | 1,000-1,800 kt | 1,800-4,000 kt |
| Silicon | 650-1,250 kt | 1,000-1,700 kt |
| Cobalt | 130-210 kt | 270-600 kt |
| Neodymium | 65-75 kt | 140-170 kt |
| Praseodymium | 20-22 kt | 45-55 kt |
| Dysprosium | 2.3-4 kt | 3.5-7 kt |
Source: KU Leuven
Amounts in metric tonnes
Mt = million metric tonnes, kt = thousand metric tonnes
While electric vehicles decarbonize automotive emissions, producing the low estimates of the nickel and cobalt needed for the global energy transition (one million tonnes of nickel and 130,000 tonnes of cobalt) would result in almost 25 million tonnes of CO2 emissions.
Understanding Nickel and Lithium’s Variability in CO2 Emissions
Mining is a highly energy and carbon-intensive process due to the large amounts of heavy machinery and equipment required to extract ore from the ground. However, it’s the processing stages of smelting and refining that typically generate the most carbon emissions.
As seen with lithium and nickel on the chart, these emissions can vary greatly depending on the deposit type and processing methods used to make different end products.
- Compared to nickel sulfide projects, nickel laterite projects can require between 2.5-6x more energy.
- Along with this, producing high-purity class 1 nickel metal emits around 13 kg of CO2 per kg of nickel, while ferronickel (class 2 nickel) emits about 45 kg of CO2 per kilogram of nickel content.
Similarly, lithium production emissions also vary depending on their deposit type and end product.
- Generally, lithium brine projects generate about one-third of the CO2 emissions of a spodumene project.
- Along with this, whether brine or spodumene, producing lithium hydroxide as the end product rather than lithium carbonate produces almost double the emissions.
While there’s plenty of variability, even the lower end of the ranges for nickel and lithium production results in large amounts of carbon emissions.
Mining’s Additional Environmental Costs
Along with carbon emissions from mining and processing operations, these projects have additional tolls on the environment.
Open pit mines dig up vast areas of land spanning multiple kilometers, releasing large amounts of dust and asbestos-like minerals. Along with this, mineral processing operations consume large amounts of water, and resulting mine tailings pose various risks if not stored and disposed of properly.
Simply put, the energy transition will require large amounts of land, energy, and water for the carbon-intensive process of metals mining and refining.


Energy Shift
The World’s Biggest Oil Producers in 2023
Just three countries accounted for 40% of global oil production last year.

The World’s Biggest Oil Producers in 2023
This was originally posted on our Voronoi app. Download the app for free on iOS or Android and discover incredible data-driven charts from a variety of trusted sources.
Despite efforts to decarbonize the global economy, oil still remains one of the world’s most important resources. It’s also produced by a fairly limited group of countries, which can be a source of economic and political leverage.
This graphic illustrates global crude oil production in 2023, measured in million barrels per day, sourced from the U.S. Energy Information Administration (EIA).
Three Countries Account for 40% of Global Oil Production
In 2023, the United States, Russia, and Saudi Arabia collectively contributed 32.7 million barrels per day to global oil production.
| Oil Production 2023 | Million barrels per day |
|---|---|
| 🇺🇸 U.S. | 12.9 |
| 🇷🇺 Russia | 10.1 |
| 🇸🇦 Saudi Arabia | 9.7 |
| 🇨🇦 Canada | 4.6 |
| 🇮🇶 Iraq | 4.3 |
| 🇨🇳 China | 4.2 |
| 🇮🇷 Iran | 3.6 |
| 🇧🇷 Brazil | 3.4 |
| 🇦🇪 UAE | 3.4 |
| 🇰🇼 Kuwait | 2.7 |
| 🌍 Other | 22.8 |
These three nations have consistently dominated oil production since 1971. The leading position, however, has alternated among them over the past five decades.
In contrast, the combined production of the next three largest producers—Canada, Iraq, and China—reached 13.1 million barrels per day in 2023, just surpassing the production of the United States alone.
In the near term, no country is likely to surpass the record production achieved by the U.S. in 2023, as no other producer has ever reached a daily capacity of 13.0 million barrels. Recently, Saudi Arabia’s state-owned Saudi Aramco scrapped plans to increase production capacity to 13.0 million barrels per day by 2027.
In 2024, analysts forecast that the U.S. will maintain its position as the top oil producer. In fact, according to Macquarie Group, U.S. oil production is expected to achieve a record pace of about 14 million barrels per day by the end of the year.
Energy Shift
How Much Does the U.S. Depend on Russian Uranium?
Despite a new uranium ban being discussed in Congress, the U.S. is still heavily dependent on Russian uranium.

How Much Does the U.S. Depend on Russian Uranium?
This was originally posted on our Voronoi app. Download the app for free on iOS or Android and discover incredible data-driven charts from a variety of trusted sources.
The U.S. House of Representatives recently passed a ban on imports of Russian uranium. The bill must pass the Senate before becoming law.
In this graphic, we visualize how much the U.S. relies on Russian uranium, based on data from the United States Energy Information Administration (EIA).
U.S. Suppliers of Enriched Uranium
After Russia invaded Ukraine, the U.S. imposed sanctions on Russian-produced oil and gas—yet Russian-enriched uranium is still being imported.
Currently, Russia is the largest foreign supplier of nuclear power fuel to the United States. In 2022, Russia supplied almost a quarter of the enriched uranium used to fuel America’s fleet of more than 90 commercial reactors.
| Country of enrichment service | SWU* | % |
|---|---|---|
| 🇺🇸 United States | 3,876 | 27.34% |
| 🇷🇺 Russia | 3,409 | 24.04% |
| 🇩🇪 Germany | 1,763 | 12.40% |
| 🇬🇧 United Kingdom | 1,593 | 11.23% |
| 🇳🇱 Netherlands | 1,303 | 9.20% |
| Other | 2,232 | 15.79% |
| Total | 14,176 | 100% |
SWU stands for “Separative Work Unit” in the uranium industry. It is a measure of the amount of work required to separate isotopes of uranium during the enrichment process. Source: U.S. Energy Information Administration
Most of the remaining uranium is imported from European countries, while another portion is produced by a British-Dutch-German consortium operating in the United States called Urenco.
Similarly, nearly a dozen countries around the world depend on Russia for more than half of their enriched uranium—and many of them are NATO-allied members and allies of Ukraine.
In 2023 alone, the U.S. nuclear industry paid over $800 million to Russia’s state-owned nuclear energy corporation, Rosatom, and its fuel subsidiaries.
It is important to note that 19% of electricity in the U.S. is powered by nuclear plants.
The dependency on Russian fuels dates back to the 1990s when the United States turned away from its own enrichment capabilities in favor of using down-blended stocks of Soviet-era weapons-grade uranium.
As part of the new uranium-ban bill, the Biden administration plans to allocate $2.2 billion for the expansion of uranium enrichment facilities in the United States.

-

 Electrification3 years ago
Ranked: The Top 10 EV Battery Manufacturers
-

 Electrification2 years ago
The Key Minerals in an EV Battery
-

 Real Assets3 years ago
The World’s Top 10 Gold Mining Companies
-

 Misc3 years ago
All the Metals We Mined in One Visualization
-

 Electrification3 years ago
The Biggest Mining Companies in the World in 2021
-

 Energy Shift2 years ago
What Are the Five Major Types of Renewable Energy?
-

 Electrification2 years ago
The World’s Largest Nickel Mining Companies
-

 Electrification2 years ago
Mapped: Solar Power by Country in 2021